


Automating Tableau Server tasks used to mean a folder full of BAT files, PowerShell scripts, and tabcmd commands held together by the patience of a single admin.
That world still exists, but it has fundamentally shifted. In 2026, there are three legitimate ways to automate Tableau Server: scripts with tabcmd (now with serious limitations), the Tableau REST API (the official programmatic path), and Autom8 (a no-code dashboard extension that lets users trigger workflows directly from a chart).
This guide explains when to use each.
The three ways to automate Tableau Server
Here is how the three approaches compare on the dimensions that matter most:
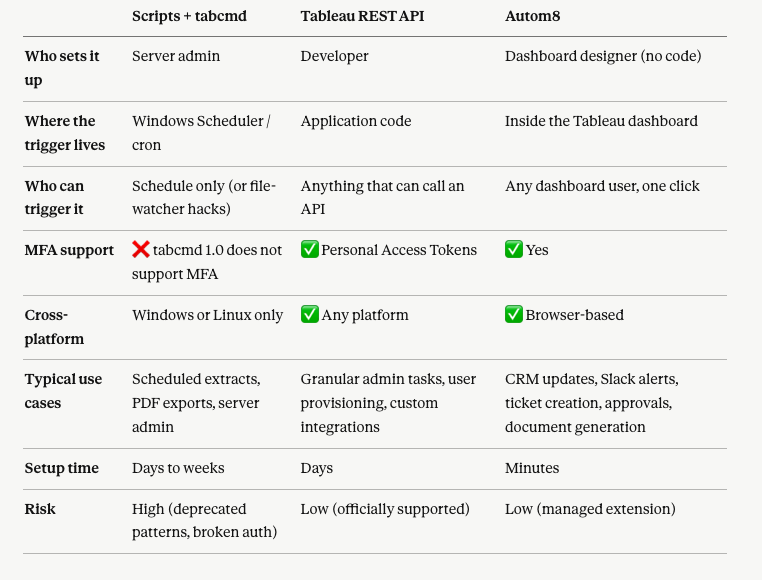
If you take one thing from the table: the script-based approach that powered Tableau Server automation for the past decade still works for narrow admin tasks, but it has accumulated real risks that most teams should not be taking on new projects.
The REST API is the right programmatic replacement. And Autom8 covers an entirely different category, one that scripts never really served well: letting end users trigger actions from the dashboard itself.
But first things first...
Approach 1: Scripts and tabcmd (the classic admin approach)
For a long time, Tableau Server admins automated everything with a wrapper of Windows batch scripts calling PowerShell calling tabcmd.exe. The typical setup looked like this: a BAT file scheduled in Windows Scheduler, calling a PowerShell script to log into Tableau Server, export a PDF or refresh an extract, then send an email if something failed.
This approach still works for tightly scoped tasks. Here is a condensed example: a batch script that downloads a dashboard as a PDF, retries once on failure, copies the file to a network share, and emails the admin if anything breaks.
@echo off
set logfile="pdf_export.log"
echo ----------- script started ----------- > %logfile%

:extractpdf
powershell .\export_dashboard.ps1 >> %logfile% 2>&1
if not exist *.pdf (
    echo First try failed >> %logfile%
    timeout /T 300 /NOBREAK
    powershell .\export_dashboard.ps1 >> %logfile% 2>&1
    if not exist *.pdf (
        powershell.exe .\send_error_email.ps1
        exit /b 1
    )
)

copy MarchePackaging.pdf \\network\folder >> %logfile% 2>&1
echo ----------- Finished ----------- >> %logfile%
exit 0
The PowerShell script behind this typically uses tabcmd login, runs tabcmd export, and logs out. Credentials are stored in an encrypted file on disk using ConvertTo-SecureString, which is read at runtime.
Why this approach is risky in 2026:
- Tableau officially advises against running tabcmd from PowerShell on Windows, noting it can cause unexpected behaviour.
- tabcmd 1.0 does not support multi-factor authentication, which most security-conscious organisations now require.
- tabcmd is only available for Windows and Linux, so anyone on macOS is locked out.
- The script lives outside Tableau Server itself, meaning when something breaks, the admin who built it is the only person who can debug the chain of BAT, PowerShell, encrypted password files, and Unix utilities.
If you have an existing script-based pipeline that works, leave it running. But for new automation work, the next two approaches are safer choices.
Approach 2: The Tableau REST API (the developer approach)
The Tableau REST API is the official programmatic interface to Tableau Server and Tableau Cloud. Almost everything you can do in the Tableau Server web UI (creating sites and projects, adding users, scheduling extract refreshes, downloading content, managing permissions) can be done through the API.
There are two main ways to work with it:
- Direct REST calls using any HTTP client (Postman, curl, Python's
requestslibrary, a Node.js app, anything). - The Tableau Server Client (TSC), a Python library that wraps the REST API into clean, Pythonic objects.
The REST API replaces tabcmd for almost every use case where tabcmd was previously used, with three big advantages:
- It is platform-neutral. macOS, Linux, Windows, anything that can make HTTP requests.
- It supports modern authentication, including Personal Access Tokens and MFA-compliant flows.
- It exposes granular operations that tabcmd never did. For example, adding a block of users from an Excel spreadsheet to a specific group with project-level permissions in a single script.
The trade-off is that the REST API requires real programming knowledge. If your team has a developer, this is the right replacement for the script-based approach. If you want a deeper walkthrough of getting started, see Biztory's existing post on how to automate Tableau Server tasks with the REST API.
Approach 3: Autom8 (the no-code dashboard approach)
The first two approaches share an assumption: automation happens on a schedule, set up by an admin or developer, running in the background. That covers a real category of work (refresh this extract every morning at 6am) but it misses a different, more valuable category: letting business users trigger actions directly from a dashboard at the moment of insight.
That is what Autom8, Biztory's no-code Tableau extension, was built for.
What Autom8 does
Autom8 is a dashboard extension that turns Tableau visualisations into action triggers. You embed it in a dashboard, configure a workflow once, and any user with access to the dashboard can fire that workflow with a single click — no Tableau Server account required, no script, no developer, no code. The same problem the original script-based approach tried to solve with a "trigger file on a network share" hack is now native to the dashboard itself.
The extension connects Tableau to your business systems (Salesforce, HubSpot, Slack, Microsoft Teams, Jira, GitHub, Trello, and others) and lets a click on a chart fire an action in any of them.
Real-world Autom8 use cases
- Update a CRM record from a chart. A sales rep spots an at-risk account on a dashboard, clicks the bar, and the customer's status in Salesforce updates instantly.
- Push a Slack or Teams alert when a KPI crosses a threshold. Inventory drops below the reorder line, an alert lands in the right channel within seconds.
- File a Jira or GitHub issue from a dashboard. A data quality problem becomes a tracked ticket without leaving Tableau.
- Approve or reject budgets, purchase orders, or expenses. A manager reviews the dashboard, clicks Approve, and the workflow moves on.
- Build a target list in your CRM directly from a dashboard view. A marketer filters to a segment, clicks once, and those contacts are added to a campaign list.
- Generate branded PowerPoint decks with live data. A monthly business review deck builds itself from current dashboard data with a single click.
- Continuously track data quality and route issues to the right team. Flag bad records, auto-assign to owners, close the loop.
Why this matters compared to scripts and APIs
Scripts and the REST API automate the server. Autom8 automates the moment a user sees something and needs to act on it.
That is a fundamentally different problem, and the one most teams are actually trying to solve in 2026. The original blog post this guide replaces ended with a section called "Allowing users to trigger a script without permissions" — a complicated hack involving a shared trigger file on a network drive, a script polling every 5 minutes, and a parameter file. That entire workflow is now a single Autom8 button on a dashboard.
Setup takes minutes rather than days. There is no server-side scripting, no encrypted password file, no Windows Scheduler, no tabcmd binary version to keep in sync, and no PowerShell deprecation notice hanging over the architecture.
Conclusion
Tableau Server automation has fundamentally changed in the last few years. The script-and-tabcmd approach that defined the previous decade still works for legacy pipelines, but it now carries real risks: no MFA, deprecated PowerShell pairings, and a maintenance burden that lands on a single admin. The Tableau REST API is the right replacement for programmatic, scheduled automation. And Autom8 covers a category that scripts never served well, letting users trigger workflows directly from a dashboard at the moment they see something that needs action.
If you are starting a new automation project, or you have an aging script-based pipeline that needs a modernisation path, get in touch with the Biztory team and we will help you pick the right approach and build it.


