Introducing a data culture
Dirk Claus: "Our focus on healthcare data really started in 2018. We decided to use the data we were managing within MLOZ to improve our customer service by extracting information derived from the vast amount of our aggregated anonymous data. Two years ago, we created a new entity called Business & Data Intelligence (BDI). The mission of this entity is to support activities such as data modeling, dashboarding, reporting, querying and data science. "
"Thanks to standardization on a selected number of platforms, methods and tools, we were able to enhance data quality and to reduce complexity and maintenance costs. We selected Data Vault and Data Architect for data modeling, DataStage for ETL development, Tableau for data reporting, Confluence for data documentation, and Jira for Agile sprint planning."
"We are currently creating new high-quality data models, on which all dashboards, reports and queries can be based to achieve data uniformity and quality. The new data models will also facilitate self-service reporting and data analysis. Next to that, we are also putting in place a new data organization. It focuses on data governance, reports, procedures, documentation, and data quality management."
Biztory scored high in the tender, especially regarding services, training, and technical know-how. Three years into the collaboration, we can say that we made the right choice.
Looking for a new reporting tool and a partner
"In the past, we had many reporting tools resulting from initiatives of multiple business entities. Such a complex reporting environment was difficult to maintain. We quickly decided to select one single reporting tool and to align reports on that tool.
"We launched a public tender for the selection of the new reporting tool and for the partner who could assist us in this journey. The public tender resulted in the choice of Tableau as a tool and Biztory as a partner."
"All the known suppliers in the market participated in our public tender. After a detailed evaluation of the submitted offers, Biztory was considered to be the best possible partner. They scored high, especially regarding services, training, and technical know-how. Having worked with Biztory for three years, we can say that we made the right choice. There is a lot of transparency in our collaboration, and they contributed to improving our autonomy to master Tableau."
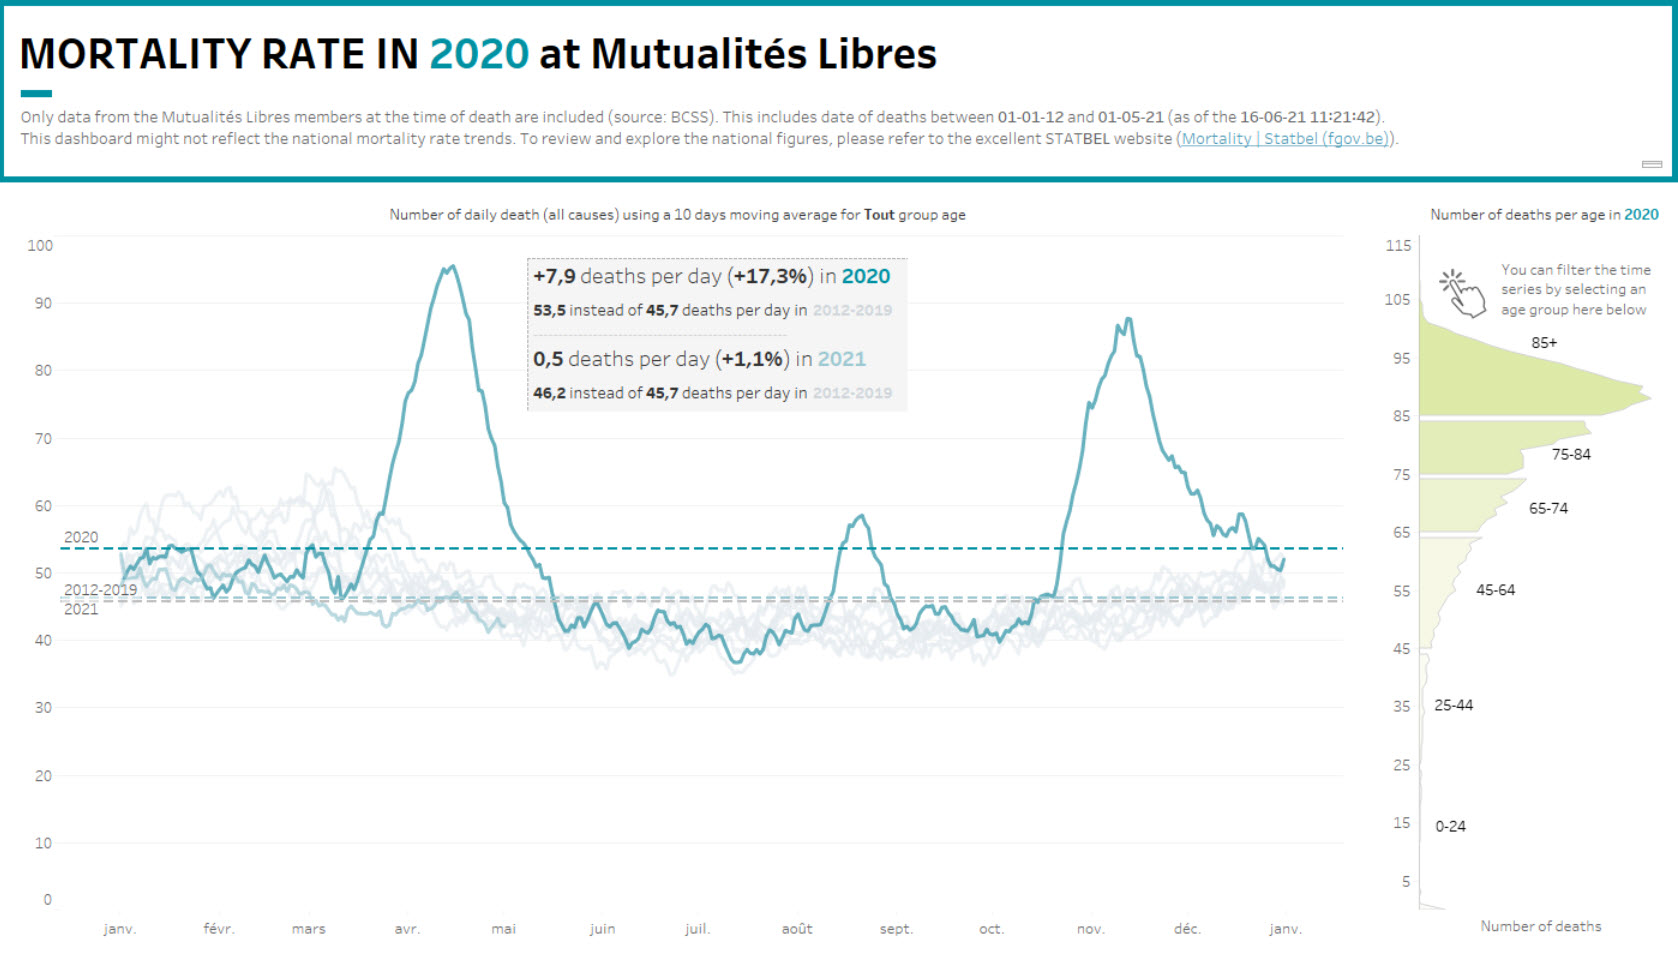
KPIs were manually entered into PowerPoint and sent via email to management. A new Tableau dashboard now allows them to consult the most recent version of the KPIs without any manual intervention.
Pull vs. Push
"Before using Tableau, we had a lot of manual work. For example, a regular overview of the staff composition in the organization was manually handled into Excel and provided to the required people. People were never sure they had the most recent version of the information. With the newly developed Tableau dashboards, information is kept up to date and privacy is secured."
"Another example is our KPIs (key performance indicators) follow-up. Previously, our KPIs were manually entered into PowerPoint and sent via email to management. A new Tableau dashboard now allows them to consult the most recent version of the KPIs without any manual intervention. Our colleagues reacted very positively to this self-service tool."
"We currently provide additional dashboards to the business, while putting in place new high-quality data models on which those same dashboards are based. This creates new insights for the business, while we are working on better data foundations for the future."

Training and in-house support
"We are pleased with the expertise we received from the Biztory consultants. With their support, we organized several two-days Tableau training sessions for around 100 data and business colleagues."
"Besides training, we also integrated one of the Biztory consultants in our team. He oversees the development of the more complicated Tableau dashboards that require in-depth graphical expertise and technical skills. He is also the sounding board for the team members when they have questions. He helps to translate the technicality of Tableau in such a way that even non-technical profiles understand it."
A real shift in the way we work
"Mutualités Libres / Onafhankelijke Ziekenfondsen handles a large amount of data. Self-service tools such as Tableau really help our colleagues display some information they need in an aggregated, graphical and interactive way. They are also sure that the information they get is always up-to-date. Thanks to the training and the in-house support, we are exploring new possibilities. Data helps us today to detect and explain some phenomena. It is also gradually supporting us to predict measures that need to be put in place to support and enhance health service and quality to the population. This shift in our way of working will be vital for our success in the coming years."


