
1. Introduction: Migrating from UA to GA4
The migration of Universal Analytics (UA) to Google Analytics 4 (GA4) in 2023 was a pretty radical change in how Marketing teams across the world would access their analytical website data.
The front-end side was impacted by how website interactions are tracked. UA relied on predefined hit types like pageviews and users. In contrast, GA4 utilizes an event-based model, capturing all user actions as events.
This means there's no need to set up specific events for common actions like page visits anymore. However, it requires rethinking how you capture user behavior and defining custom events to gain deeper insights. For most teams that only access this data through the web console this will be the only impact they notice.
That said, the back-end of GA4 underwent a significant overhaul compared to UA as well. Gone are the hit-based data collections and predefined reports. Instead, GA4 leverages a flexible event-based schema.
Every user interaction is captured as an event with specific parameters stored in a JSON format table. This allows for a more granular view of user behavior and easier customization. However, this also means data analysts need to be familiar with querying this format to extract the insights they require.
This last point is the key take-away: if you know how to access the raw data (instead of relying solely on the web console), you open the door to much more in-depth analysis of your user interactions!
1.1 GA4 Web Console (GWC)
One simple example to show the limited usage of GA4 Web Console; if you browse to the GWC for a basic report on events:
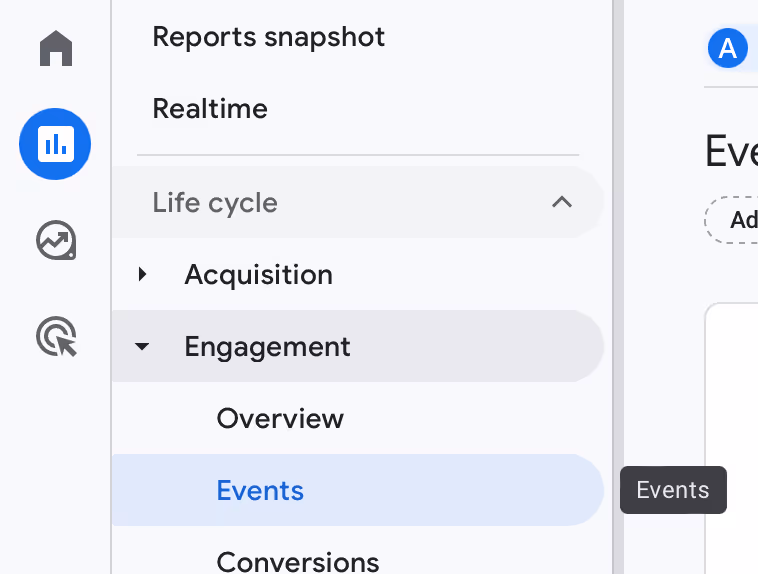
You will notice that you can only analyze your data over two dimensions!
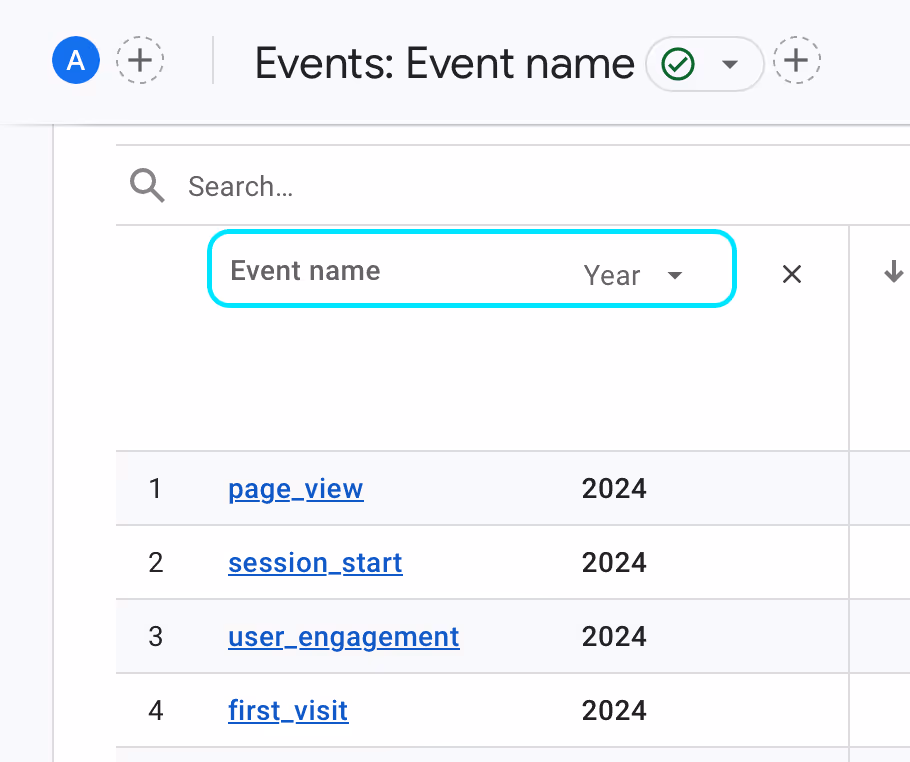
So if you want to track e.g. event type over a certain period (year) as well as divided by a certain source (organic, etc.) you… can’t!
The reason for this is known; Google offers the GWC service free of charge, but for them there are certain compute costs that they incur. Every action you take in the GWC means behind the scenes Google has to provide the CPU to actually be able to calculate what you want to see. And so to limit the amount of CPU cost they simply limit the complexity of the calculations you can perform in the GWC.
You can play around a bit with the filtering (e.g. move the time dimension to a filter) but this still limits the distinction/comparison between periods you can make. You can then create the same report for every time period of course; this will all be very time consuming and require a lot of manual input! Most people working in a Marketing Team would prefer to be able to extract as granular a dataset as possible, so they can play around a bit in their favorite data-analysis tool (like Tableau).
1.2 GA4 Raw Events
The solution for this is in the end pretty straightforward. We will simply move the raw data (the actual events) to a database of our choice, and by providing the CPU ourselves (e.g. by creating a BigQuery database) we can make the calculations and analyses as complex and in-depth as we want.
1.3 GDPR & Privacy
One very important comment before we get started is on the European Union GDPR implications of all this. In the end you will be creating essentially a new database where all of the website user interactions are stored.
In the regular GWC, the retention period can be set to up to 14 months maximum (meaning that website traffic of more than 14 months ago will be deleted). In theory however, with BigQuery you could choose to save this data indefinitely!
We therefore highly recommend to:
- check with your company’s data protection officer if this does not interfere with existing privacy policies
- set the retention period to no longer than a couple of months → know you can always extract aggregated (and therefore anonymous) reporting without having this event/user granularity. These extracts (e.g. CSV) can be kept for as long as you want.
Once we reach the point further down this post where one can configure all this, I will let you know.
2. dbt configuration for GA4
To be able to access the raw data, and subsequently model it in dbt we will need to go through a number of instructions, configurations and set-up accounts so bear with us…
High level you will need:
- A working GA4 Analytics account & property
- A working Google Cloud Platform account, including:
- At least one project
- Billing
- BigQuery API
- A (free) Developer dbt Cloud account, including:
- the link to the above BigQuery database
- the GA4 “package”
2.1 GA4
To set up GA4 follow these instructions.
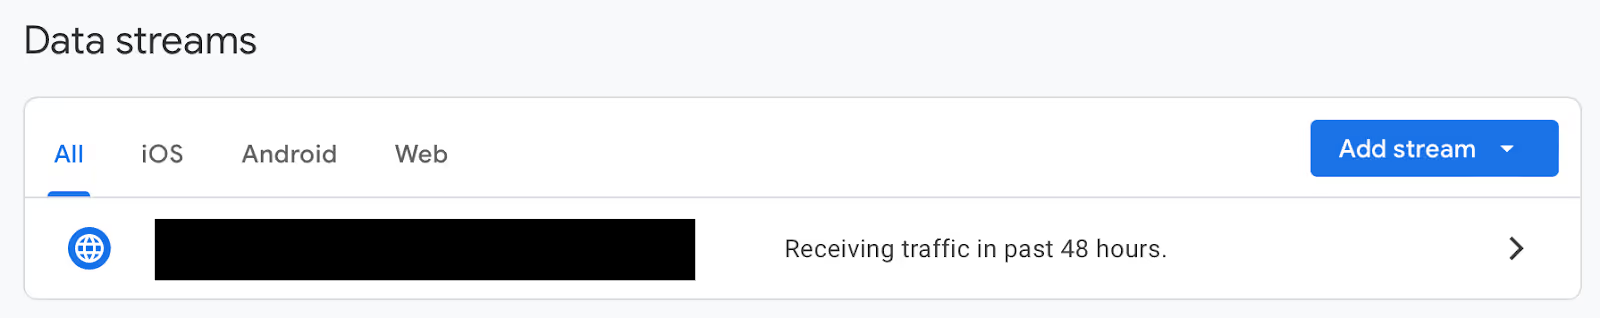
Make sure to have at least one Data Stream active!
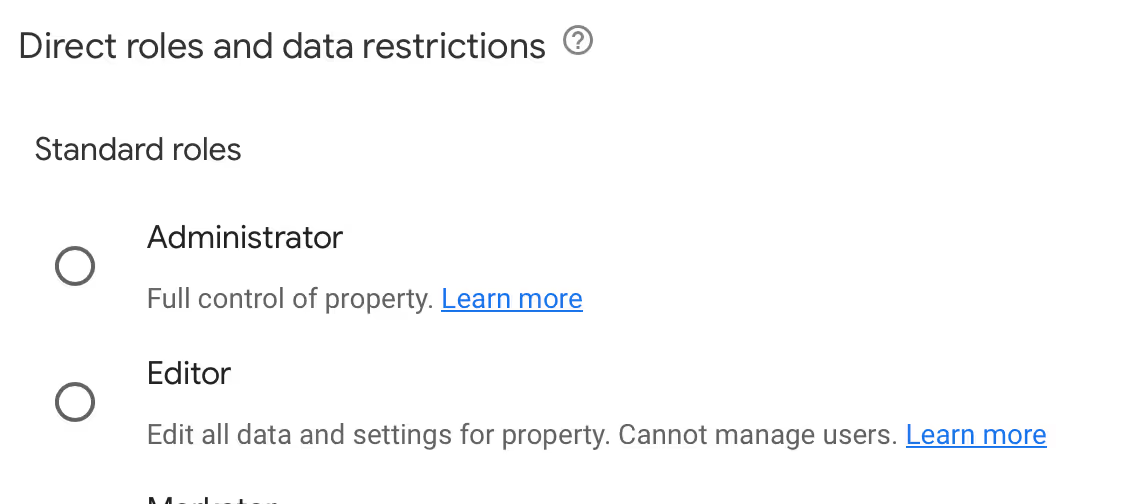
Also you need at least an Editor role in the GA4 property whose data we want to capture (not needed on the account level)
2.2 Google Cloud Platform (GCP)
To set up a Google Cloud Platform account follow this set-up wizard.

Make sure you have at least one “Project” configured, by following these instructions.

One important note: you will need to have a Billing account enabled on this project, by following these instructions.
→ While this means you will need to add a credit card, you can rest assured that with 99,9% certainty*, the eventual usage will fall well under Google’s free tier or Cloud Services.
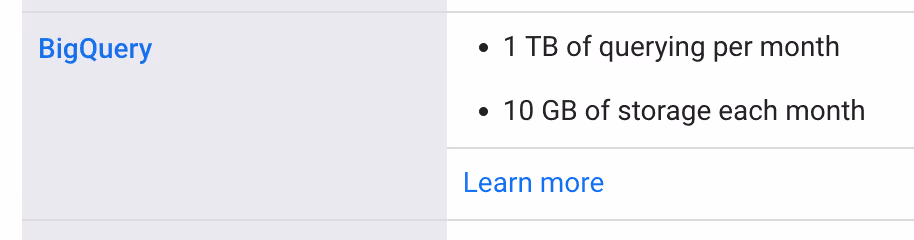
→ a free trial of $300 is also included which will be sure to cover all increased usage during set-up and initial testing, as well as offer you a risk free way of monitoring what your monthly usage will be in the end.
* Unless your website has a bajillion daily visitors. I have been using this for well over a year on a 30k daily visitor website and have not incurred a cent of costs over that period.
2.3 dbt
If you want to know what dbt actually does you can find more information on our own website here, or feel free to reach out to one of our Biztory Data Engineers!
To set up a (supposedly always) free dbt developer account follow this set-up wizard.

If you’re not going to use dbt for anything other than this GA4 flow (your loss!) you could theoretically just follow along here, pummel through errors you won’t understand and get it working once and then never look back.
However, dbt is such an awesome tool that I recommend doing one or two dbt Fundamentals tutorials first before we move on. You will thank me later!
2.4 BigQuery
I personally find this the most difficult and the longest step, so be sure to properly and patiently follow these instructions.
The actual instructions are “Step 1”, “Step 2” and “Step 3”. All the other paragraphs are FYI, but nonetheless very useful to process.
2.4.1 Comment on Sandbox
Important is the following comment on step 2 (the sandbox):
“The BigQuery sandbox lets you explore limited BigQuery capabilities at no cost to confirm whether BigQuery fits your needs.
The BigQuery sandbox lets you experience BigQuery without providing a credit card or creating a billing account for your project. If you already created a billing account, you can still use BigQuery at no cost in the free usage tier.”
So if you already have a billing account (which we did before when setting up the Google Cloud Platform), you can directly start using the regular version of BigQuery.
If you do choose the sandbox (no credit card needed then) note there will be additional limits applied (such as no SQL DML allowed), which was a dealbreaker for me. On top of that, I’m also using other Free Tier services which require the billing account, such as the geocoding API.
2.4.2 Comment on Schedule
Be sure to choose “daily” when you reach this step:

This will make sure you limit the initial usage during set-up. Once you have a feel of how much usage it takes to analyze your website traffic you can upgrade this to streaming.
2.4.3 Verify the Results
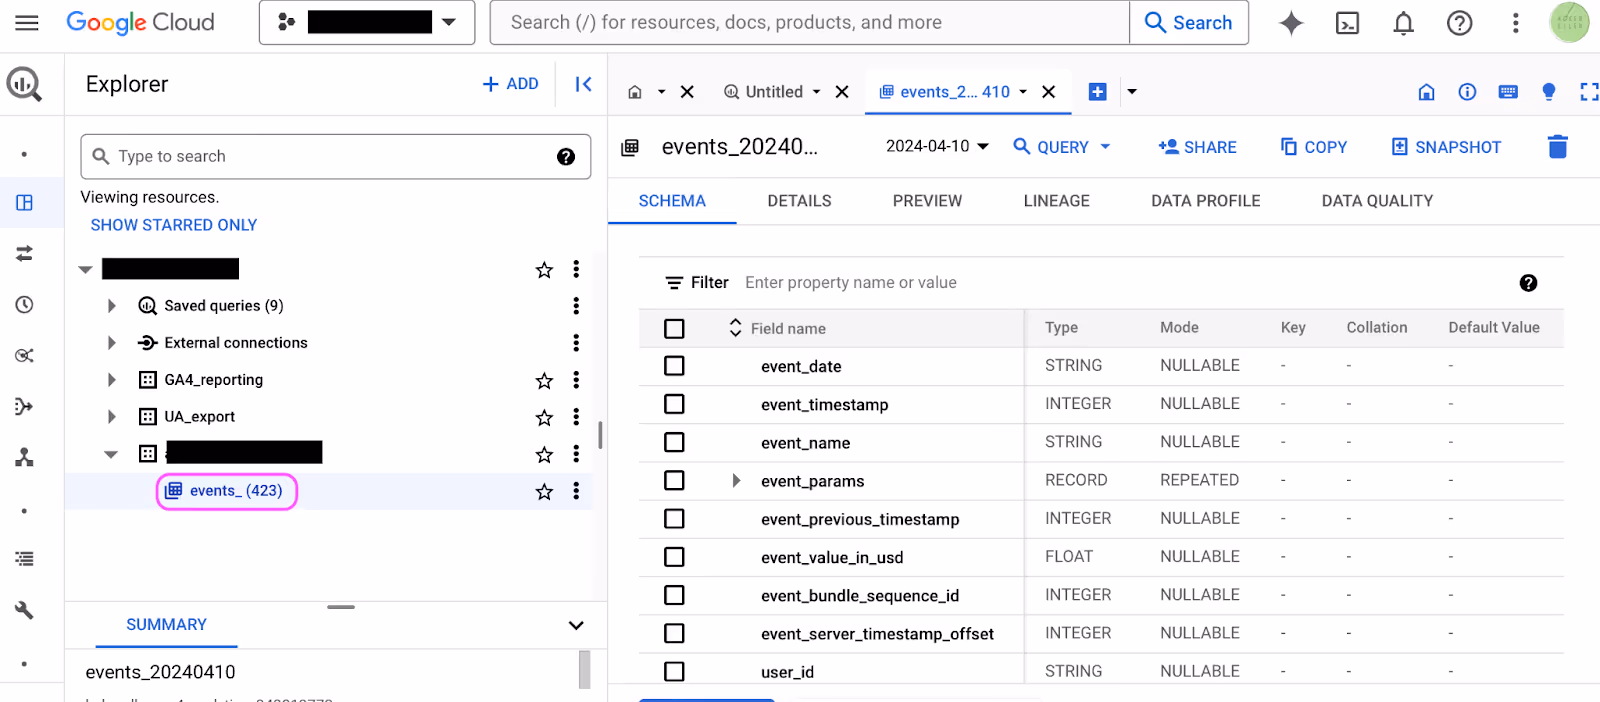
If all of the above was successful you should be able to navigate to the BigQuery Explorer and start seeing one “event_” table be exported for each day that the stream has been active.
2.4.4 Data Structure
The raw events are stored in a SQL table in BigQuery, where every row represents one event. Note however that the table is not normalized and as such some of the columns contain nested arrays of data and Key-Value Pairs:
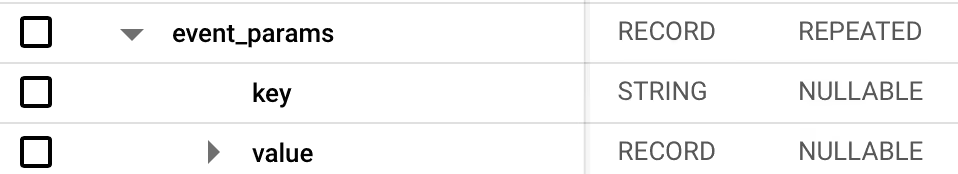
If you want to do ad hoc analysis of the events (which is not necessary, dbt can take care of all SQL logic for you later on) you will need to get handy with the unnest() function.
Here’s an example query for you that you can use to start making sense of the normalized/flattened data:
with tmp_unnest as (
select
parse_date('%Y%m%d', event_date) as event_date
,timestamp_micros(event_timestamp)as event_timestamp
,event_name
,user_pseudo_id
,(select value.string_value from unnest(event_params) where key = 'page_title') as params_page_title
,(select value.string_value from unnest(event_params) where key = 'page_location') as params_page_location
,(select value.string_value from unnest(event_params) where key = 'page_referrer') as params_page_referrer
,(select value.string_value from unnest(event_params) where key = 'link_url') as params_link_url
,(select value.int_value from unnest(event_params) where key = 'ga_session_id') as params_ga_session_id
,(select value.int_value from unnest(event_params) where key = 'ga_session_number') as params_ga_session_number
,device.category as device_category
,device.web_info.browser as device_browser
,device.language as device_language
,geo.country as geo_country
,traffic_source.name as traffic_source_name
,traffic_source.medium as traffic_source_medium
,traffic_source.source as traffic_source_source
from `[your-project-name].[your-dataset-name].events_*`
where _table_suffix between '20230101' and '20231202')
select
event_date
,event_name
,params_page_title
,params_page_location
,params_page_referrer
,params_link_url
,params_ga_session_id
,params_ga_session_number
,device_category
,device_browser
,device_language
,geo_country
,traffic_source_name
,traffic_source_medium
,traffic_source_source
,count(*) amt_of_rows
,count(distinct event_timestamp) as amt_of_events
,count(distinct user_pseudo_id) as amt_of_users
from tmp_unnest
where event_name in ('page_view','first_visit')
and event_date between '2023-01-01' and '2023-12-01'
group by all
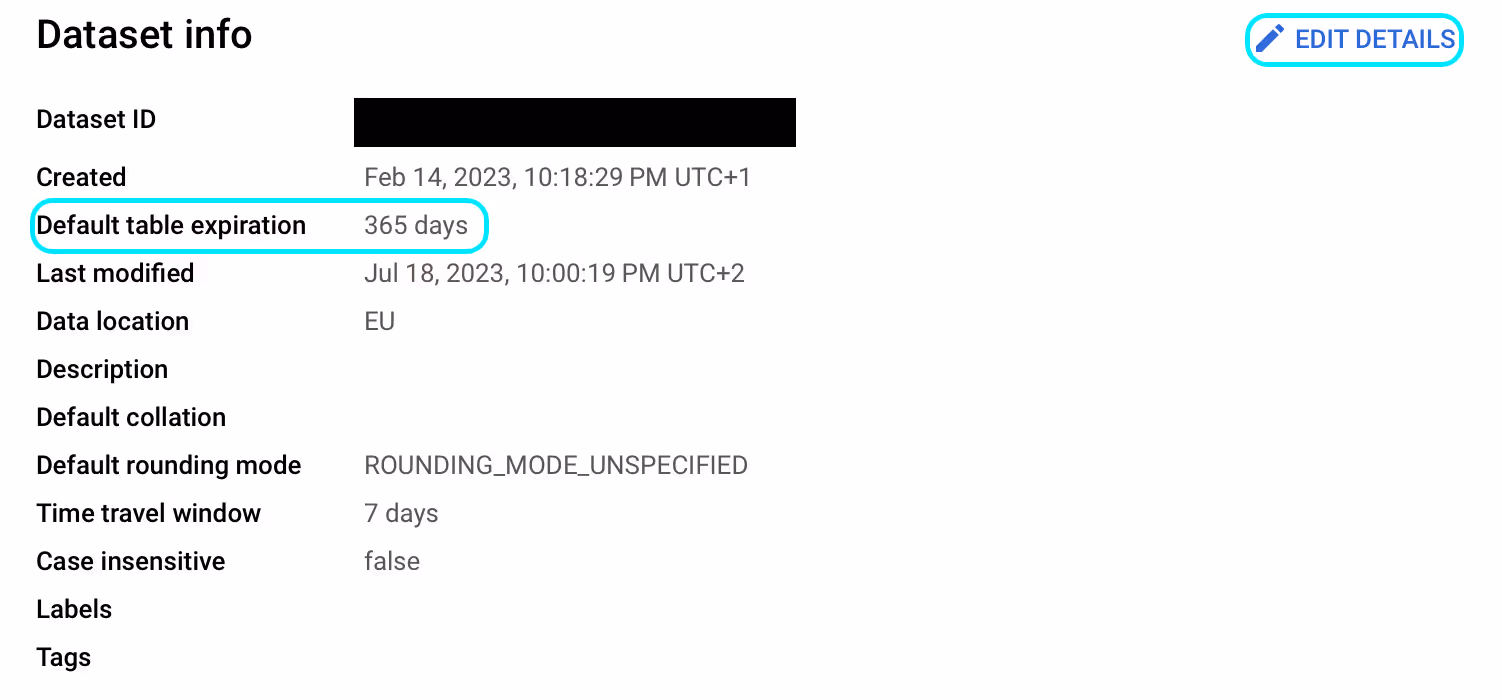
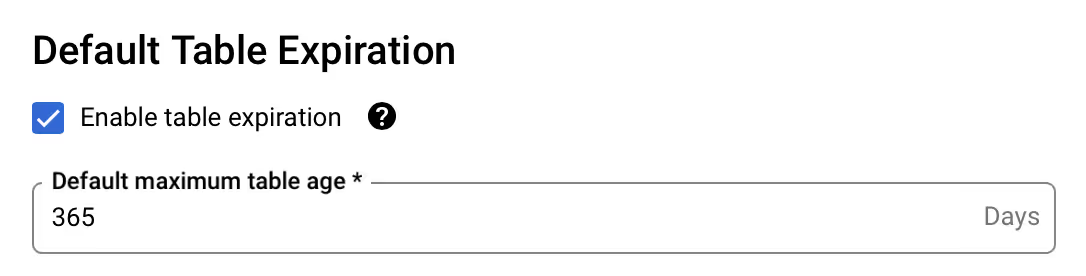
2.4.5 Data Retention
As promised, this is now the time to set the data retention period of your events (GDPR).
2.5 dbt-BigQuery Link
You can link your newly created dbt cloud account to your BigQuery database by following this Quickstart guide.
Note that, if all went well, the first step (“Create a new GCP project”) should already have been handled earlier.
Also the guide assumes you have no data yet and therefore dbt offers a dummy dataset (on a “jaffle shop” which I only recently found out is the down under equivalent of a panini sandwich) which you can use in this set-up.
If you’re completely new to dbt as well, I would recommend following along until the end to get a feel of some basic dbt functionality. If not, feel free to ignore the Jaffles and know that we already have our awesome GA4 dataset!
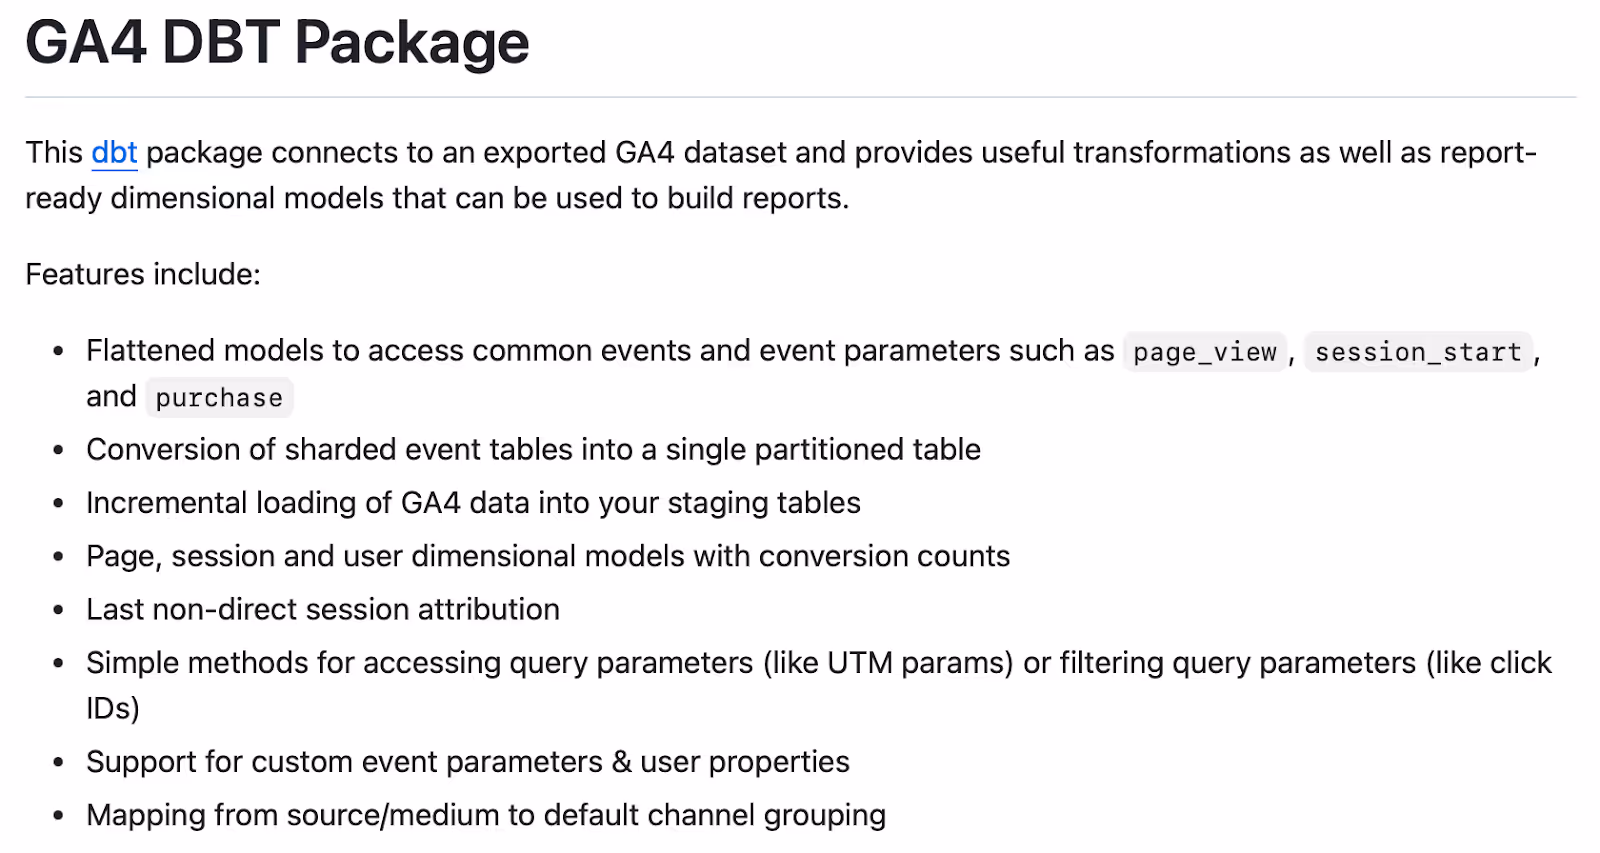
2.6 dbt GA4 Package
For this step you will need to install a dbt package, more specifically the GA4 dbt package.
This can be done by the following steps:
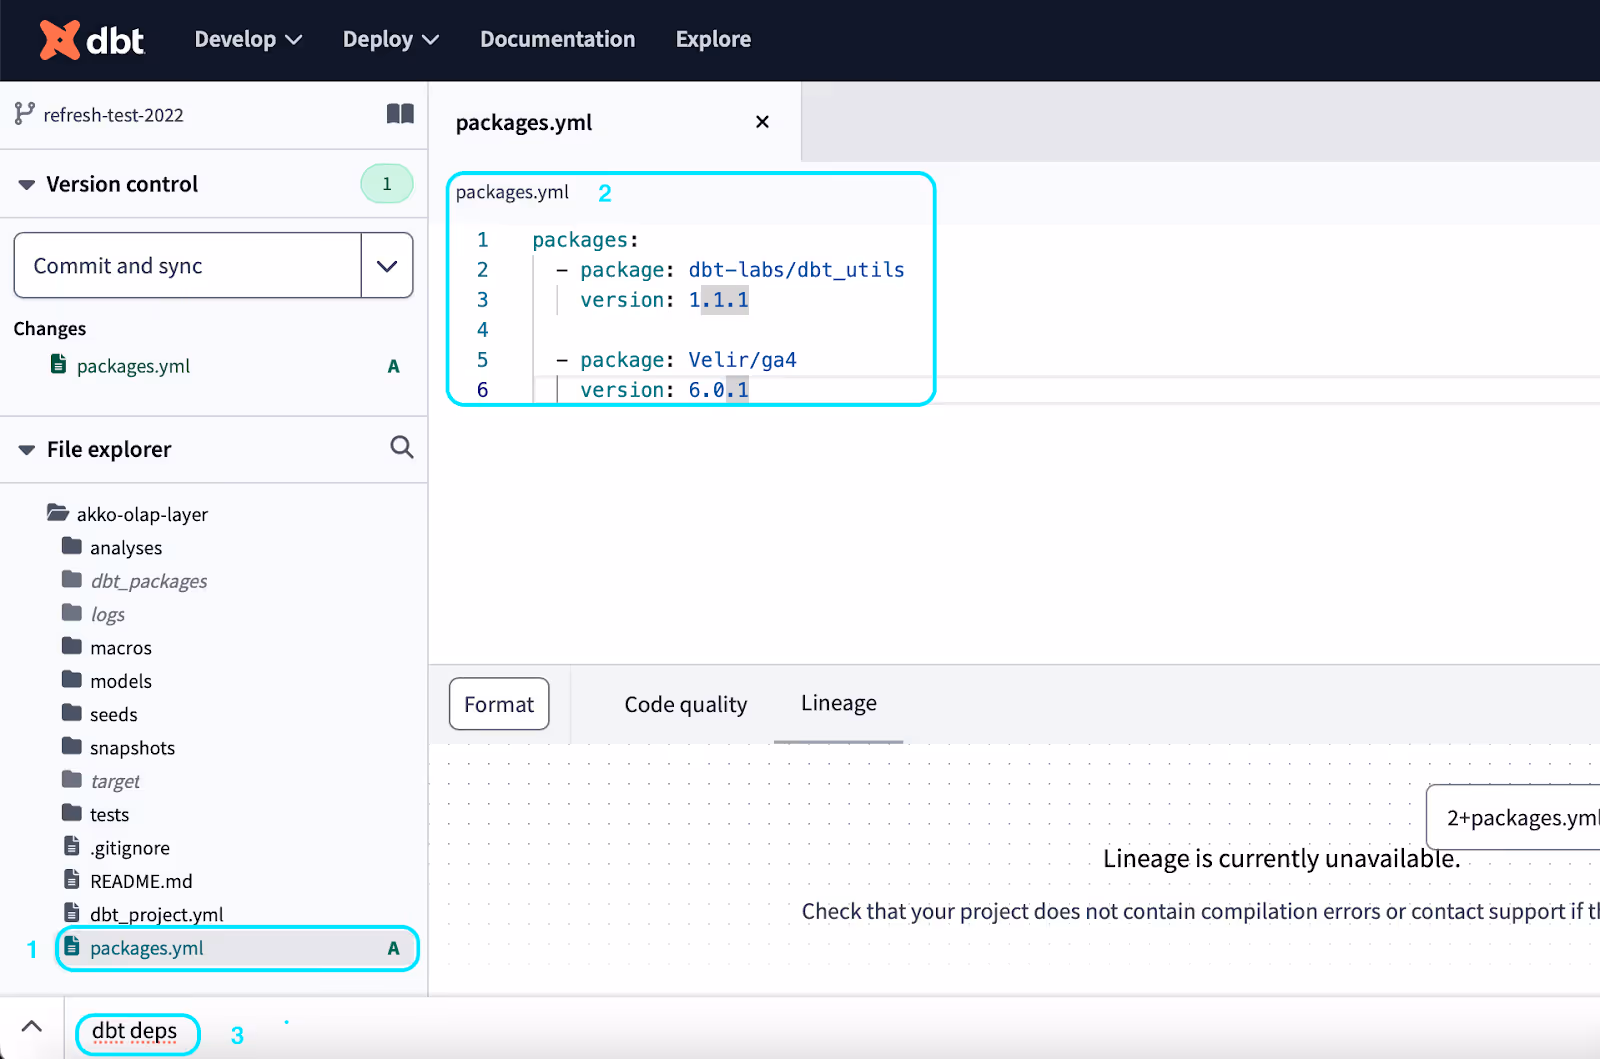
Step 1: adding a packages.yml file to your project, and pasting the package version there. Paste the following code in the file to get the handy dbt_utils package as well.
packages: - package: dbt-labs/dbt_utils version: 1.1.1 - package: Velir/ga4 version: 6.0.1
Step 2: Afterwards you will have to run the dbt deps command to install the package.
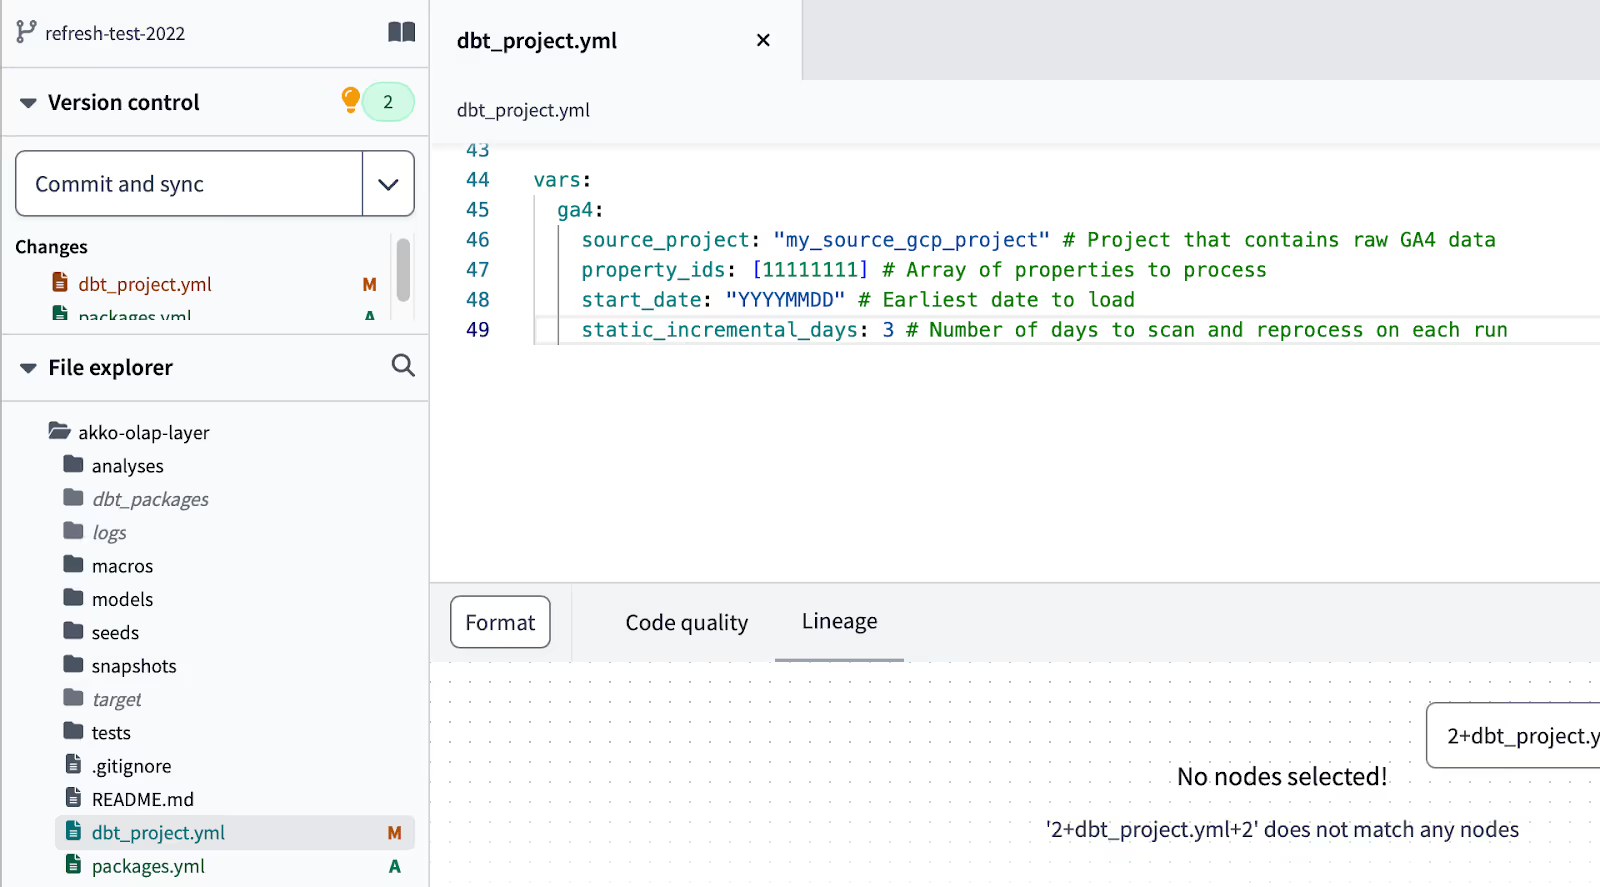
Step 3: Next we define some mandatory variables in our dbt_project.yml file. Do this by copying the following code to the bottom of that file:
vars: ga4: source_project: "my_source_gcp_project" # Project that contains raw GA4 data property_ids: [11111111] # Array of properties to process start_date: "YYYYMMDD" # Earliest date to load static_incremental_days: 3 # Number of days to scan and reprocess on each run
→ the property_ids can be found be looking at the suffix of your dataset name:

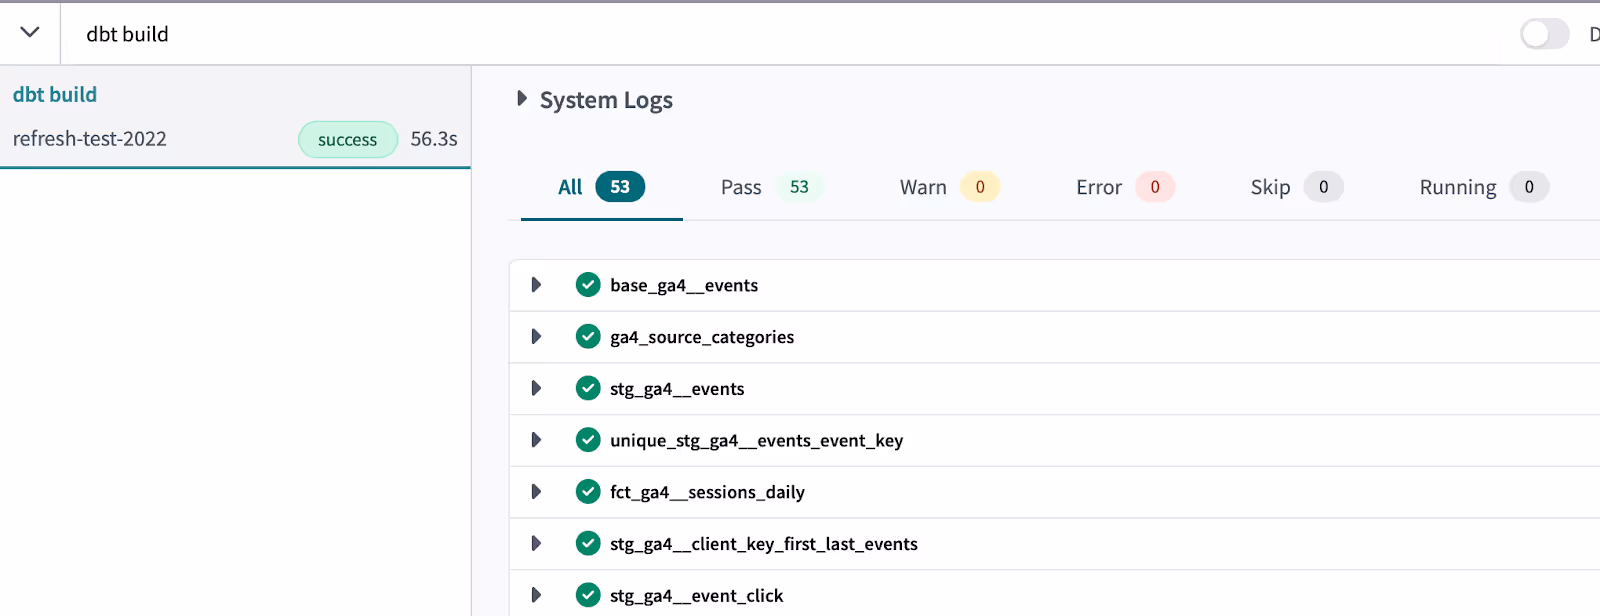
Step 4: As a last step we run the dbt build command to build all the necessary views and tables into our BigQuery database.
2.7 GA4 Kimball Data Warehouse
If successful you should see several fact and dimension tables appear under a newly created “dbt_” dataset.
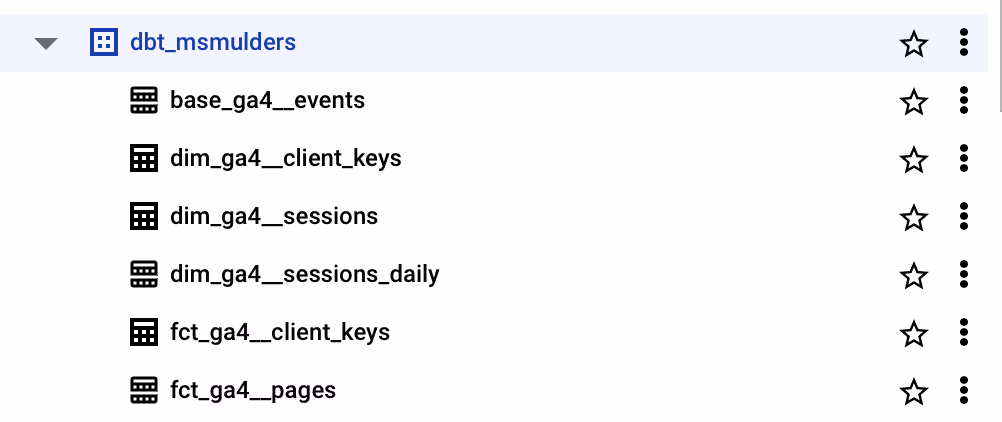
These represent the data modeled according to Kimball’s warehousing techniques.
2.8 Scheduling and Refreshing
You have two options of maintaining/updating the data (as all of the above metrics are tables and as such do not automatically receive fresh events).
You can:
- deploy a dbt production environment, and create a dbt job there to run the dbt build command on a certain schedule. How to do this should have been handled in the dbt Fundamentals course.
- convert all tables and incremental models to views (which only have to be built once and forever more will have the freshest data when called) by modifying the package. This however requires extensive knowledge of both git and dbt so we will not be handling that here.
3. Conclusion
When all of this is done you can access the metrics as you please! Feel free to reach out to us if you have any need for assistance with any of this.