Planning and Organising
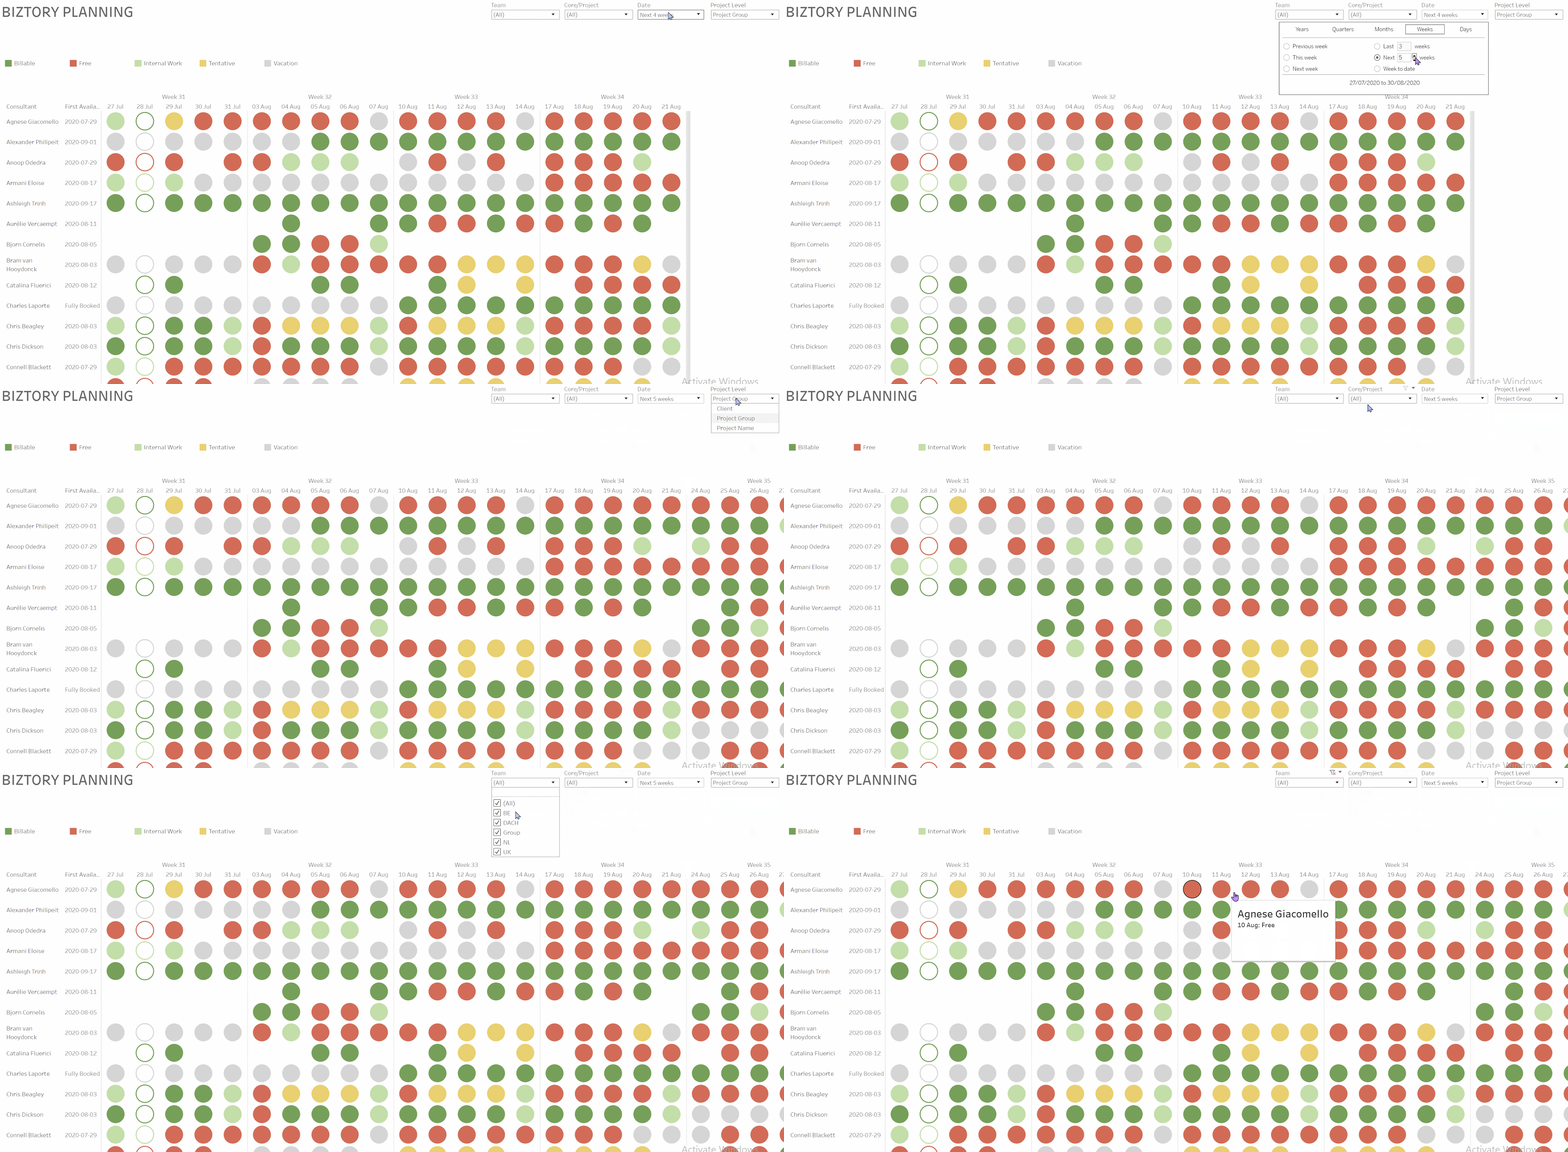
The planning overview dashboard is a calendar view created in Tableau. It shows us how each consultant's working time is allocated. This has been helping us tremendously to plan ahead and keep organised - aiding us to become more efficient as consultants, as well as making the sales process smoother.
Talent Development
Learning and developing new skills are an important aspect of everyday life at Biztory. We like to keep track of and celebrate both progress and achievement.
The Talent development framework created in Tableau is a set of practical and effective dashboards which maps out where we are and what we'd like to achieve on our Professional Development. The most popular dashboard in the framework is the skills overview dashboard. Here, you can find many useful resources put together by our Biztory experts for learning as well as what measures are available to fulfil:
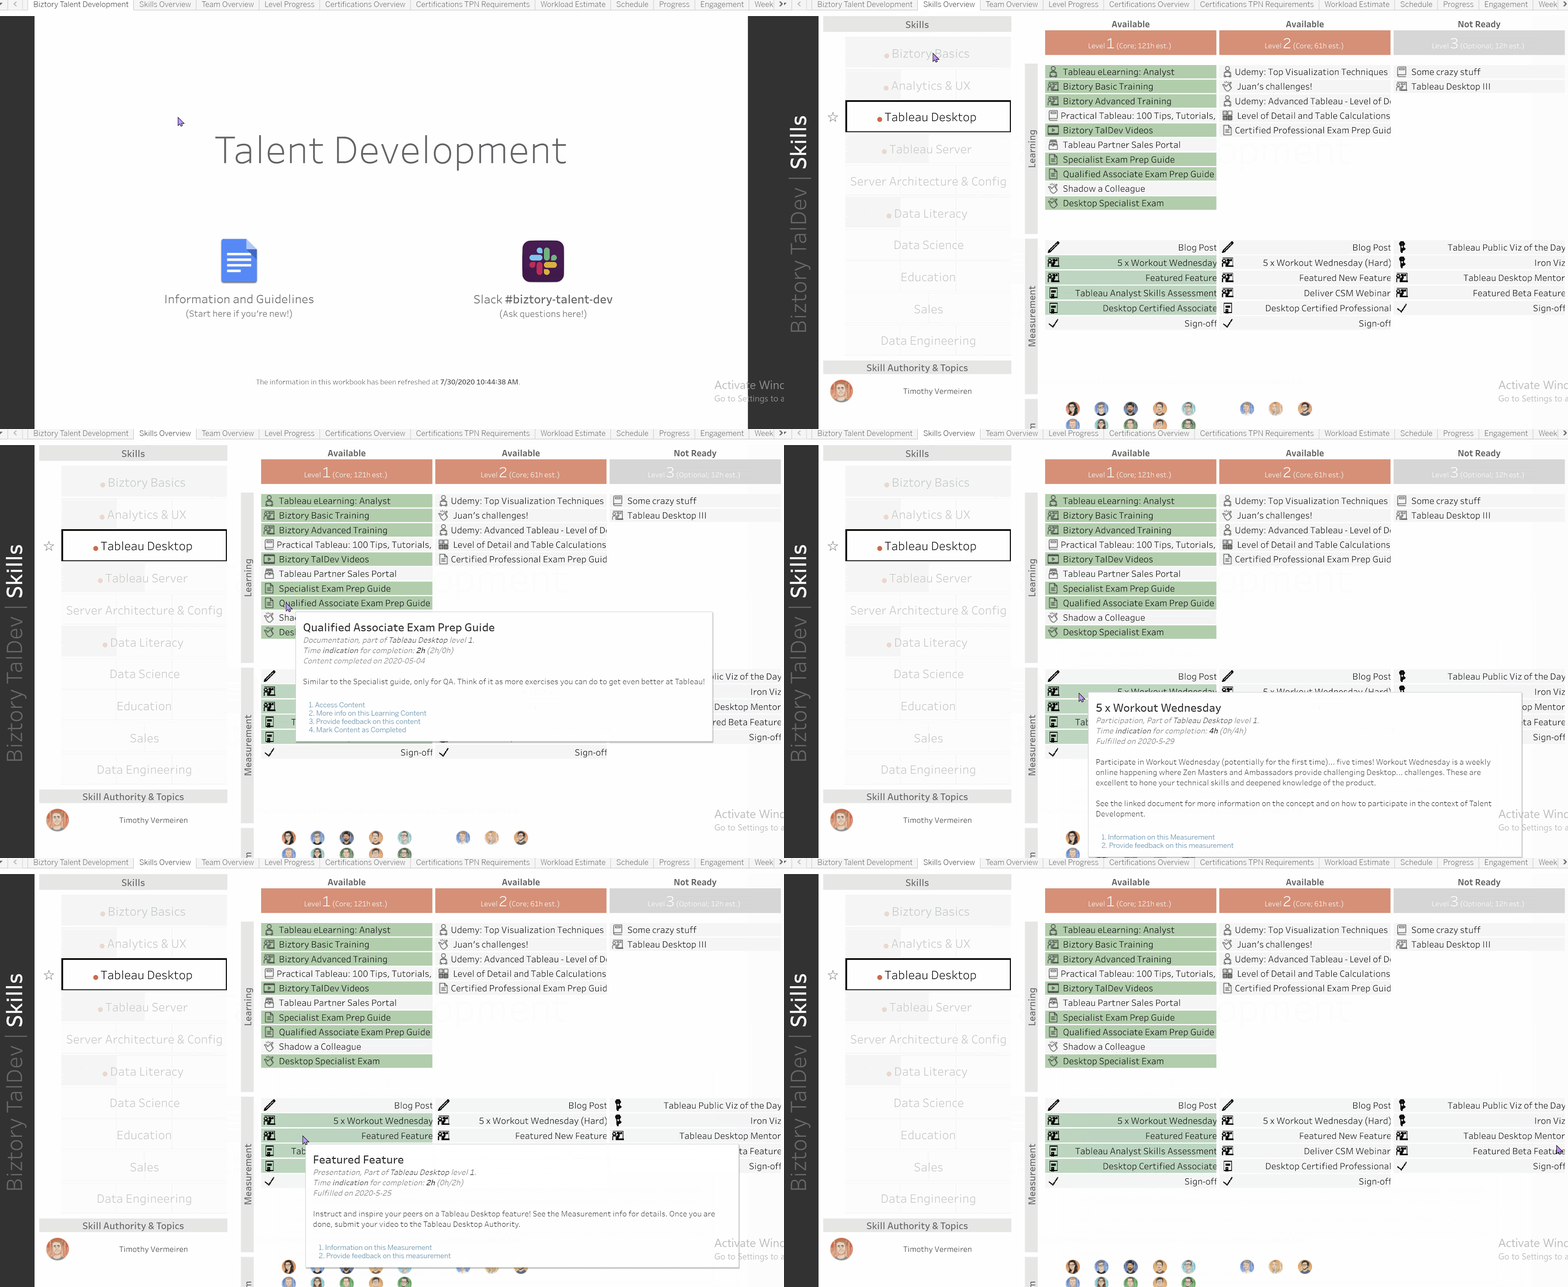
The framework also includes dashboards on Team overviews, level progressions , Certifications overview , engagement and Graduations!
Biztory Anniversary and Birthdays
Often forgot about your colleague's anniversary/birthday?
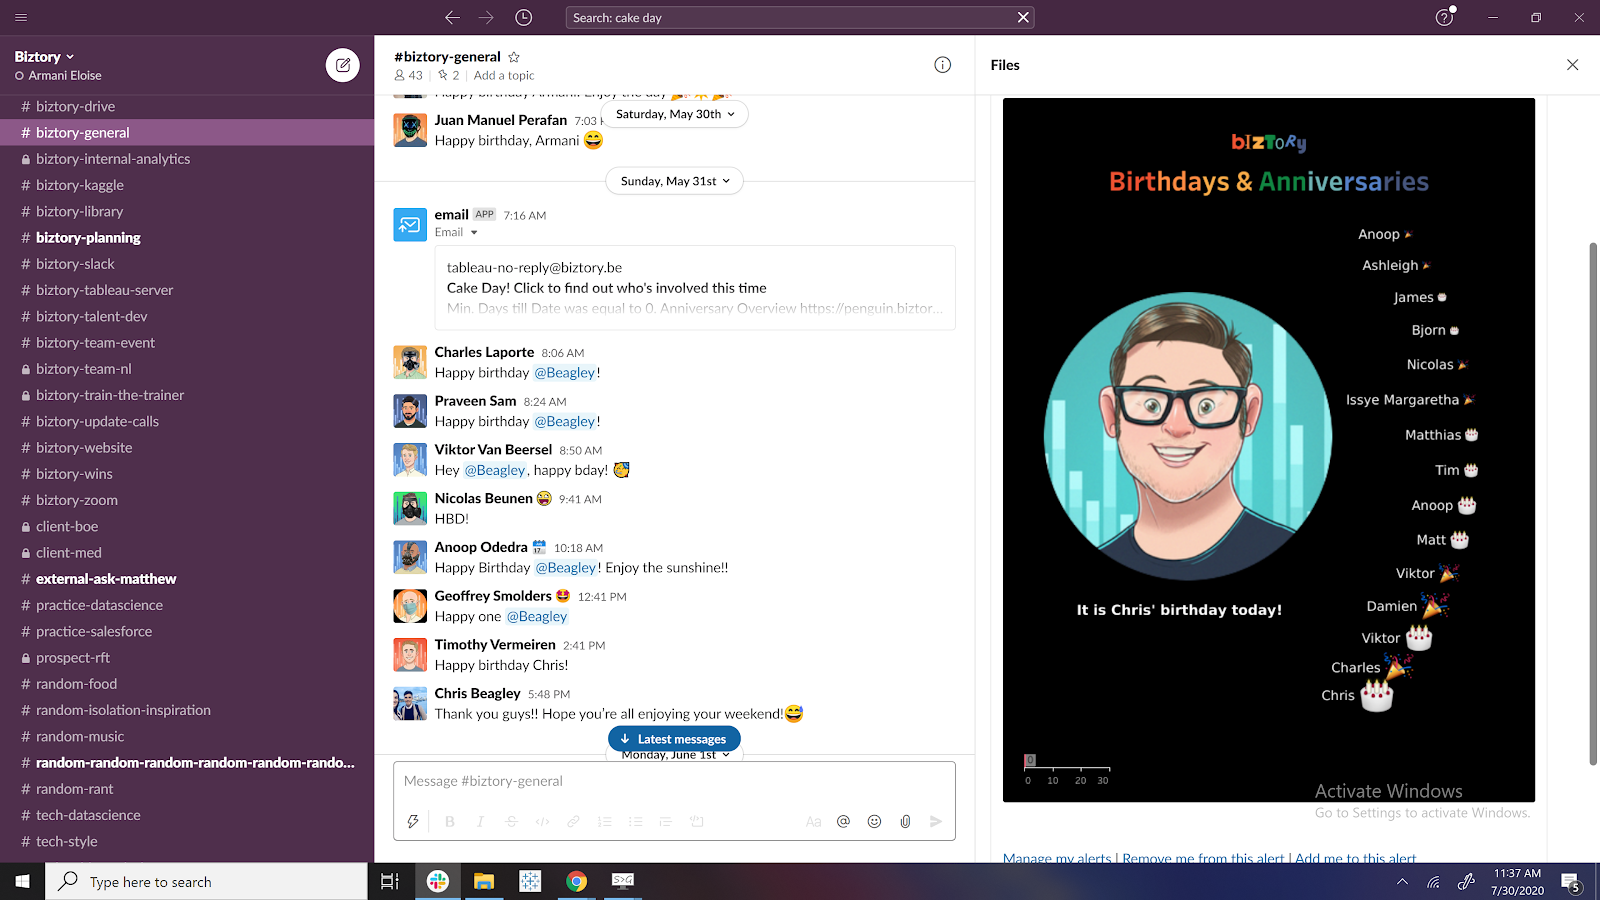
Our Biztory birthday dashboard is used to make sure we will never forget to congratulate them on their special day, because every one of us matters.
We have integrated Tableau with Slack, so each time someone has a birthday or Biztory anniversary we can flood them with congratulatory messages :)
Slack Usage
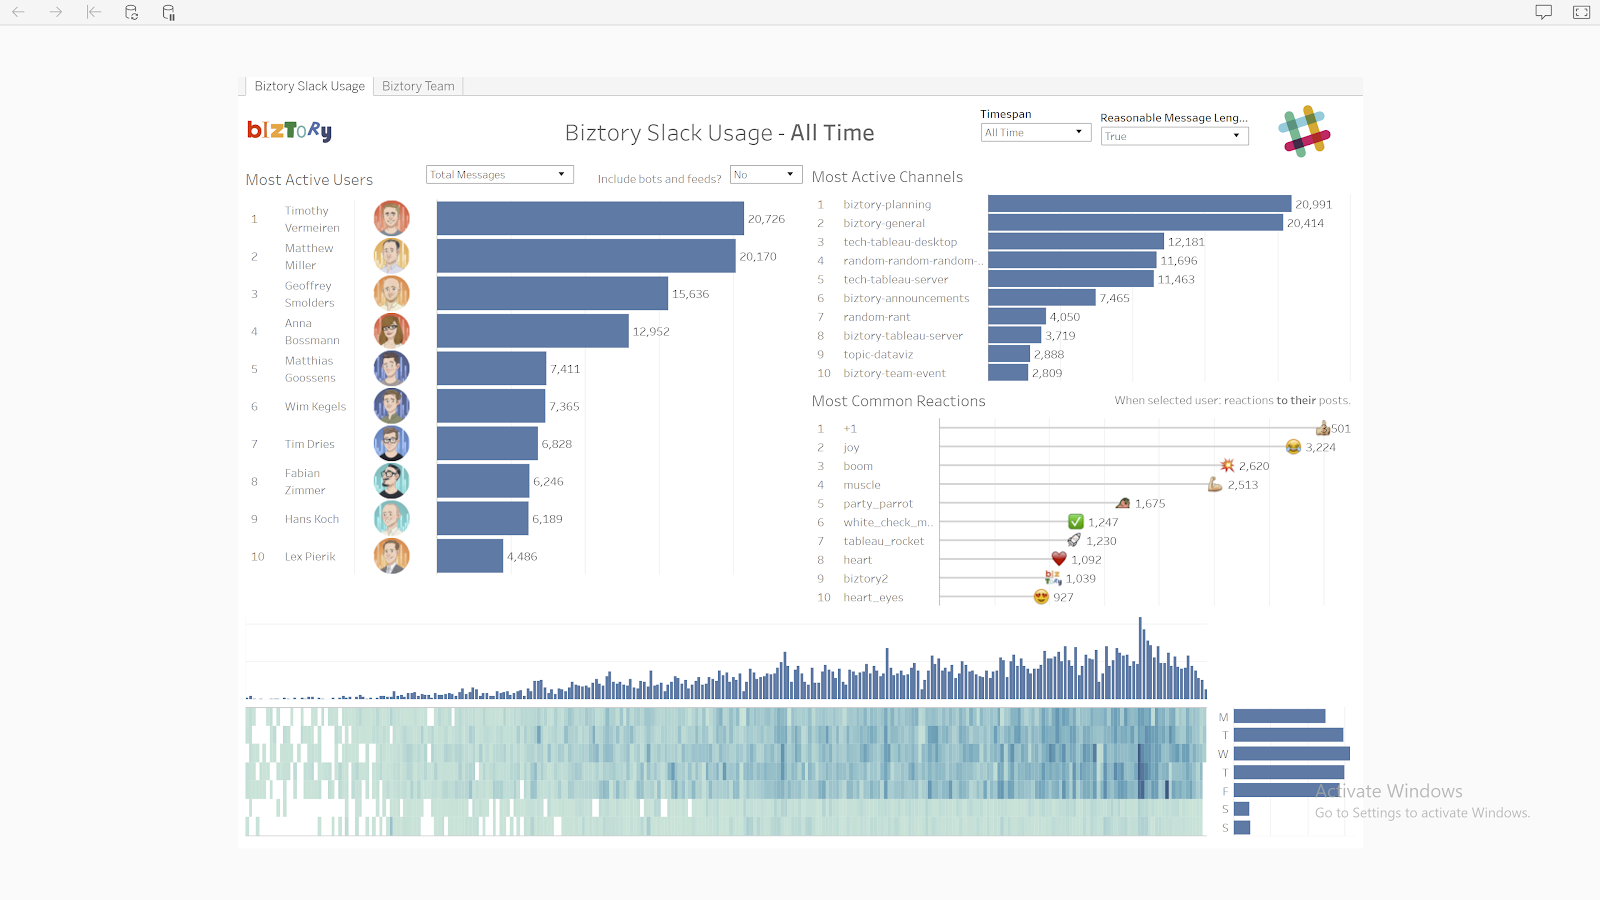
Ever wondered what Slack channels or emoji’s are most popular? Or how many messages you have sent this month? - We have a dashboard for that too!
As Slack users, we can request Tableau views & dashboards directly out of Slack just by interacting with the App or import the data from Slack and create our own views:
Sales Pipeline
The sales pipeline dashboard is used to keep track of current deal statuses, deal amounts and days since the last engagement with the clients. It is mainly used by the sales team at Biztory to keep on top of all the new deals coming in!
