Geocoding with R in Tableau
Mapping engine in Tableau
Tableau has a brillaint mapping engine where you can map all the roles in the drop-down menu (left), by creating the longitude and latitude values for you. Though, at least for the UK, postcode is limited to the outward code which is the first part of the postcode - typically before a space. This is designated to the postal town and district in the town, but just the outward code will not provide enough detail for higher granularity such as street or a house.
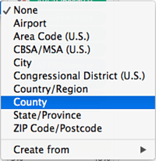
Mapping the geographical role
Using R mapping APIs
There are many packages in R that utilise mapping APIs to geocode data, such as: ggmap, photon, and nominatim. There are three main APIs that are used in these packages (that I am aware of): Google, Bing and OSM (Open Street Map).
Part of the process was choosing which API to use. Bing and Google APIs are no longer free and will require an API key for it to work. OSM is free and accessible though not as thorough or accurate as Google or Bing.
In this example, I have chosen to use the Google API since it works under a pay-as-you-go pricing model per query but has a 12-month free trial with $300 – that is 60,000 queries. From personal experience, it seems that Google only counts the successful queries so don’t worry about the failed runs coming out of your free trial. The only negative of using the free trial is that you will still have to put in some payment details so it is useful to read the billing emails you will receive from Google.
So first thing you will need is to have Rserve set up to connect to R in Tableau, if you have not done so then there are instructions in the Using R in Tableau blog. Once that is done, you will need to install the relevant package(s) in R for geocoding. I will be using the ggmap package, which defaults to using Google Maps API.
The ggmap package is very extensive and contains many functions, for the purposes of this blog we will use a few but the main one is geocode().
Getting your Google Cloud Platform credentials
To get started you will need to register for a Google Cloud Platform account, create a Project, set up your billing details – it is optional for the free trial but free credits are always great to have in my opinion.
The next step is to generate an API key so that R can access the API. In the menu bar of your Google Cloud Platform console select Credentials under the API & Services menu (right). Then select Create Credentials which gives you the option of different types, but we need an API key. That will give you an API key, you will get a prompt suggesting you apply restrictions to the key which is not necessary but is good practice.
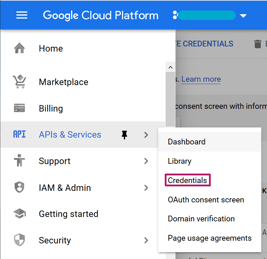
Getting your credentials from the GCP console
We now need to let ggmap know that we have an API key, use the register_google()function in R, like so:
register_google(key = "[your key]")
Though do use a key you set up instead of [your key]. That will set you up for the current session so if you restart R, you will need to register a key again; to set your key permanently use the argument write = TRUE in the function too.
Using the geocode function
The geocode function requires the following input values:
geocode(location, output = c("latlon", "latlona", "more", "all"), source = c("google", "dsk"),…)
This means that the only field we must have is the location though the other fields might help you get more precise figures. More information regarding the other fields can be found in their documentation.
With that set up the next step is to have some data with fields that you wish to geocode. I will be using data on a very small chain of cafes that I like (they have cardamom buns which smell and taste divine and their cinnamon buns are also super tasty). I have gathered the addresses of the cafes (shown below).

Creating the calculated fields in Tableau
Google Maps API uses a very well-maintained database, so it is unlikely that we will need to use postcode and city fields to find the café locations. The street and postcode fields are useful for non-business or named building locations. However, since these are all cafés, we can use just the name and the branch which shows general locations in London.
Create the field to input as the location in the function in the required format – in this case just the name and the branch.
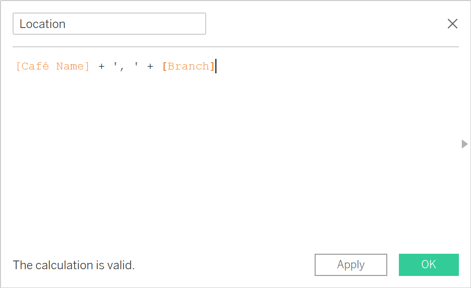
Then I created the calculated field which will give me the latitude via the geocode() function in R - the calculation is shown below. I used SCRIPT_REAL since the output is a real number. One important thing to remember is that in the R code that is passed to R requires loading the necessary packages in too, hence the 'library(ggplot2); library(ggmap);' in the script. I assigned the function to loc (the name isn't important) so that I can extract just the latitude values.

Using the geocode function for creating the calculated field "Latitude"
The same calculation is used for the longitude, but using loc$lon to extract the longitude values instead. Tableau did not recognise the calculated fieldsas geographic automatically in my workbook, so I manually assigned them to their respective geographic role.
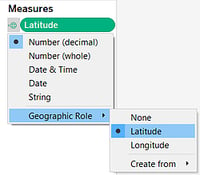
Manually assign the geographical role
Then to plot the points on a map in Tableau (as shown below) bring in the location field first, then bring in the calculated longitude and latitude fields and a map should appear. TADA!

Locations plotted on a map in Tableau
Accuracy of the plotted locations
These points will be the same as the results that you would receive from a query in Google Maps. Below, the two maps show the Shoreditch branch: the left shows the output of the outward postcode; whereas, the right shows the output from the geocode function. It is apparent as to why (at least in the UK) using just the postcode is inaccurate.

Outward Postcode Map versus Google API map
This was just a little bit of insight into geocoding in Tableau using R. The accuracy of the result generally depends on how well established the locations that you use as input or how specific the address is.
I also used the geocode function to locate a list of schools and home addresses in a county for a school bus network. This worked well with the Google API, the only real issues there were ambiguous names for schools, very new build properties, and rural homes.
Conclusion
This connection to R might make your dashboard a bit slow if you are querying on a large amount of data. So, for large data sets I would recommend that the longitudes and latitudes are queried in R first then import the data into Tableau. Though, if it is a continual project where the data might be refreshed wiht new locations, Tableau Prep Builder is also a great tool to utilise the Rserve connection which can then be used to keep the data up-to-date.
There it is, geocoding in Tableau - done!
Ashleigh Trinh
Technical Consultant @ Biztory
