How to use Set Actions in Tableau Desktop
Set actions are a powerful finishing touch, making your visualisations come to life, enabling users to interact with the dashboard as well as giving them more control over what they would like to see. If you have used set actions, you'll have noticed the options available at the bottom of the dialog box highlighted in yellow:
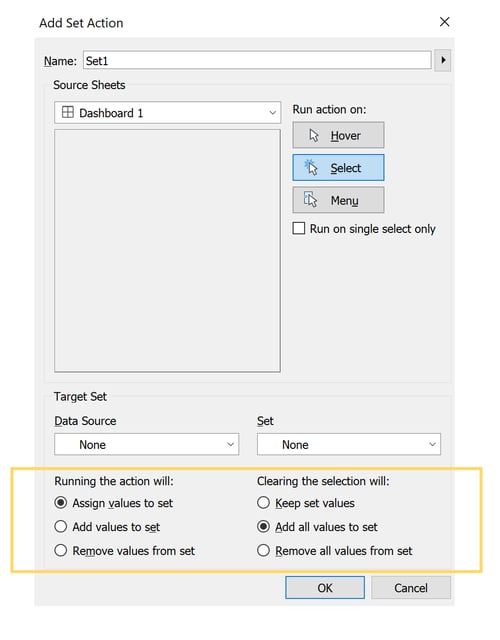
It can be slightly tricky to imagine what is happening with each selection in context of your visualisation - which is why I find it quite useful to think of basic visual examples so that I can be sure about which options to choose without going back and forth from the dashboard to the dialog box.
Below, I have a pretty simple dashboard which shows the availability of products in a bakery chain in different cities across The Netherlands, the total sales value per store, and a set contents table which indicates which cities are in or out of the set based on the product selection:
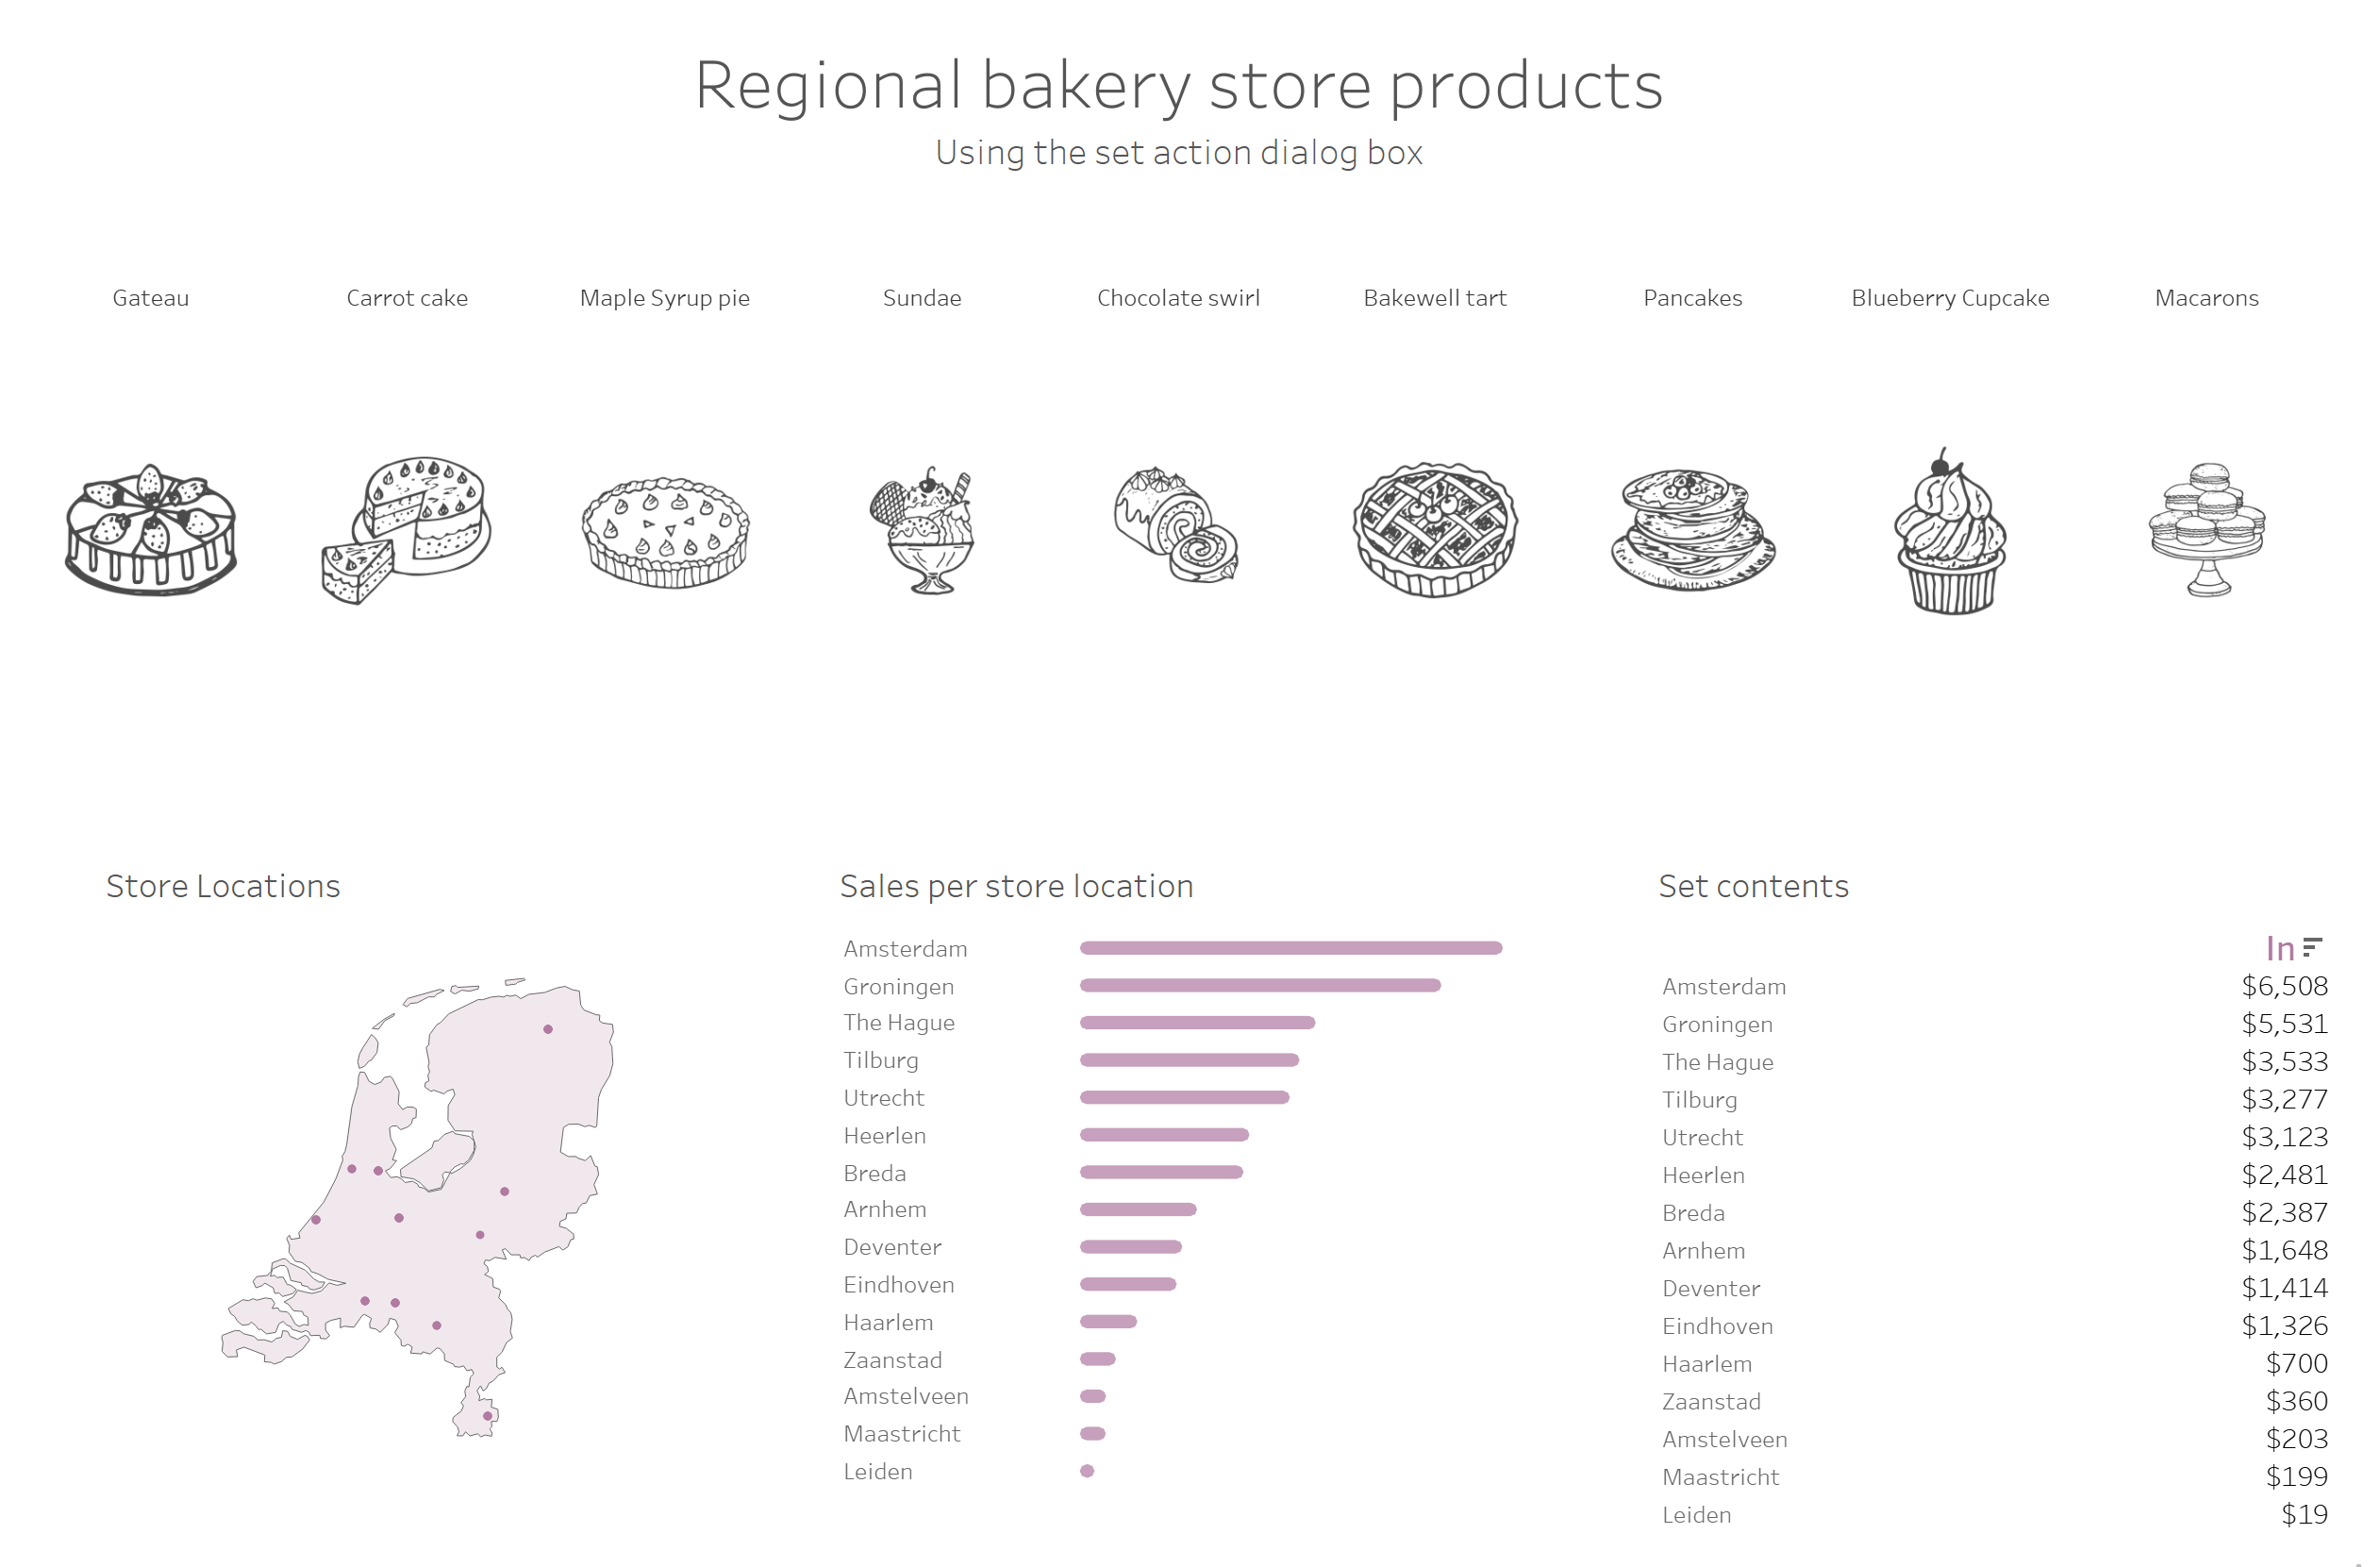
I am using set actions as I would like the flexibility in choosing products, or several, whilst still having other options in the view to choose from. I have also added the set onto the colour mark which indicates that the greyed out products are out of the set and the darker products are in the set.
Let’s explore the different options!
Running the action will…
1. Assign values to set
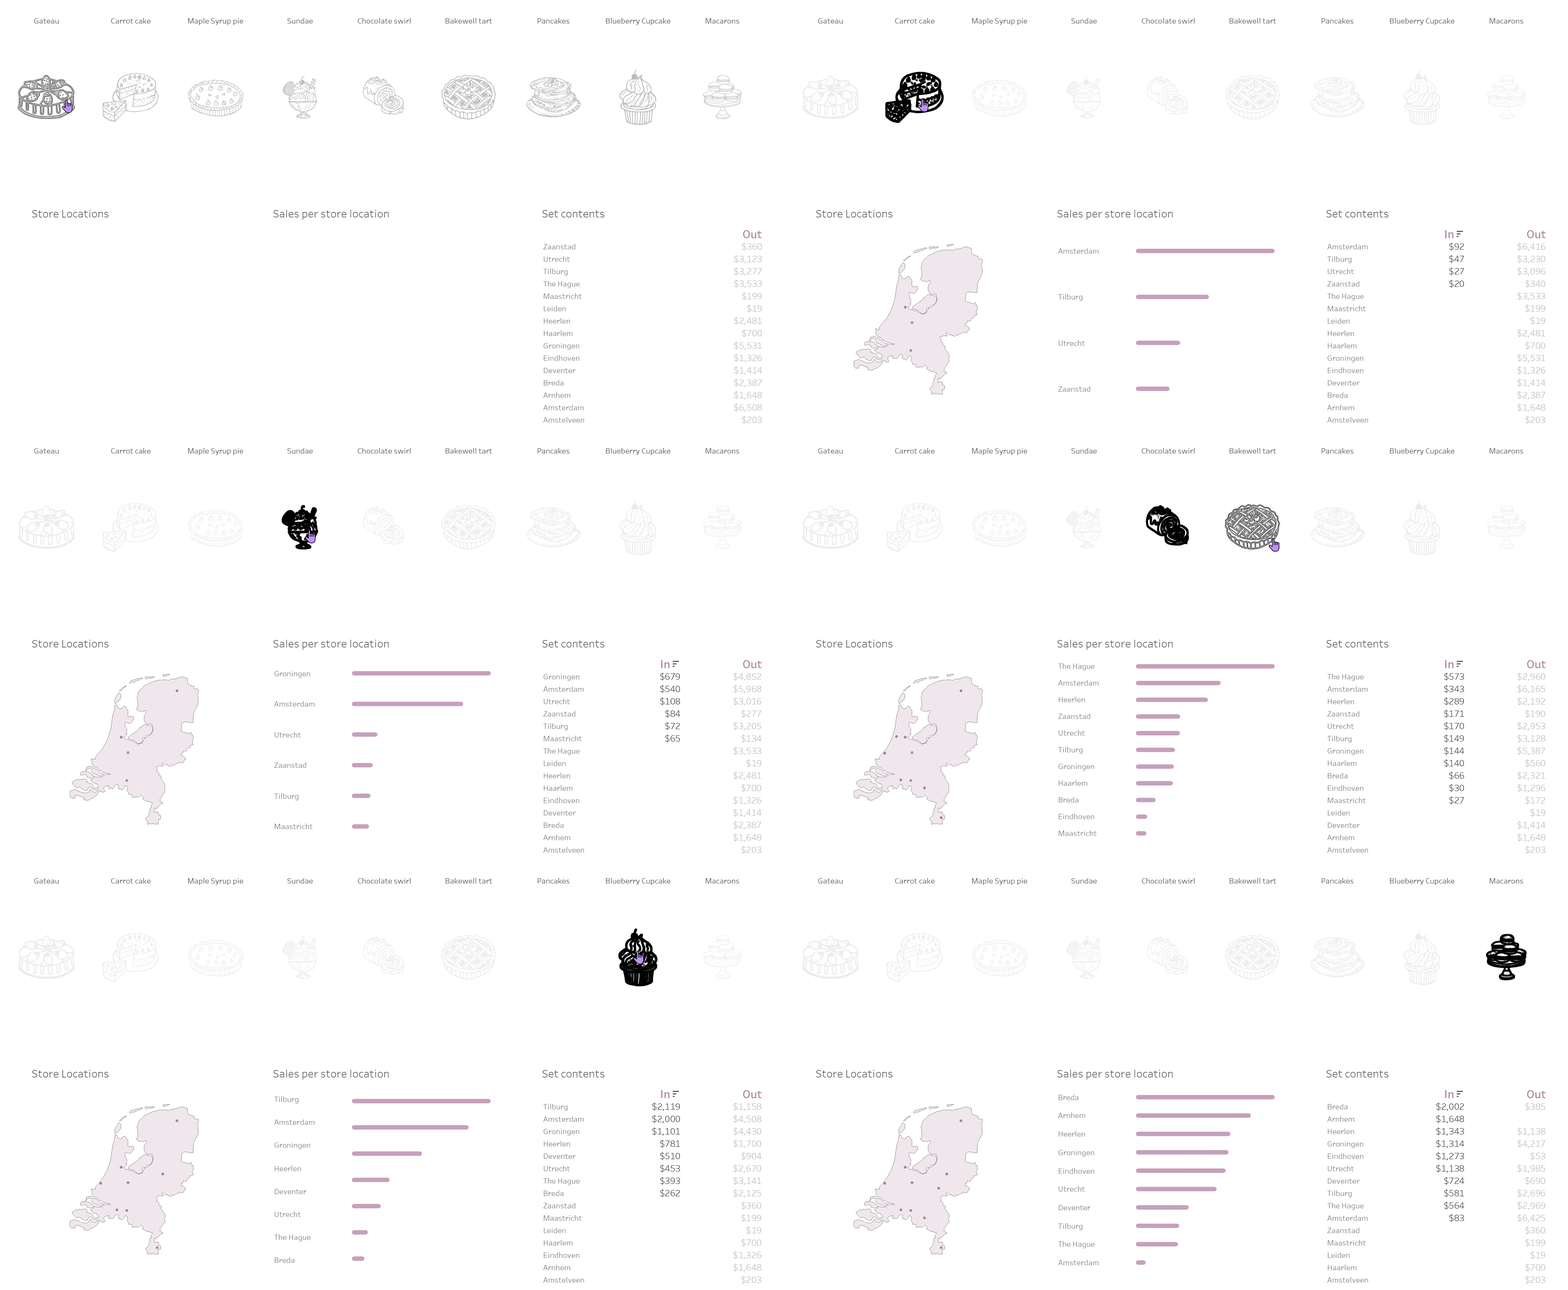
This option is useful if you would like to look at your data more precisely, focusing on one product at a time. Every time I make a selection, the store locations and sales information repopulate and only data for the selected product is shown:
2. Add values to set
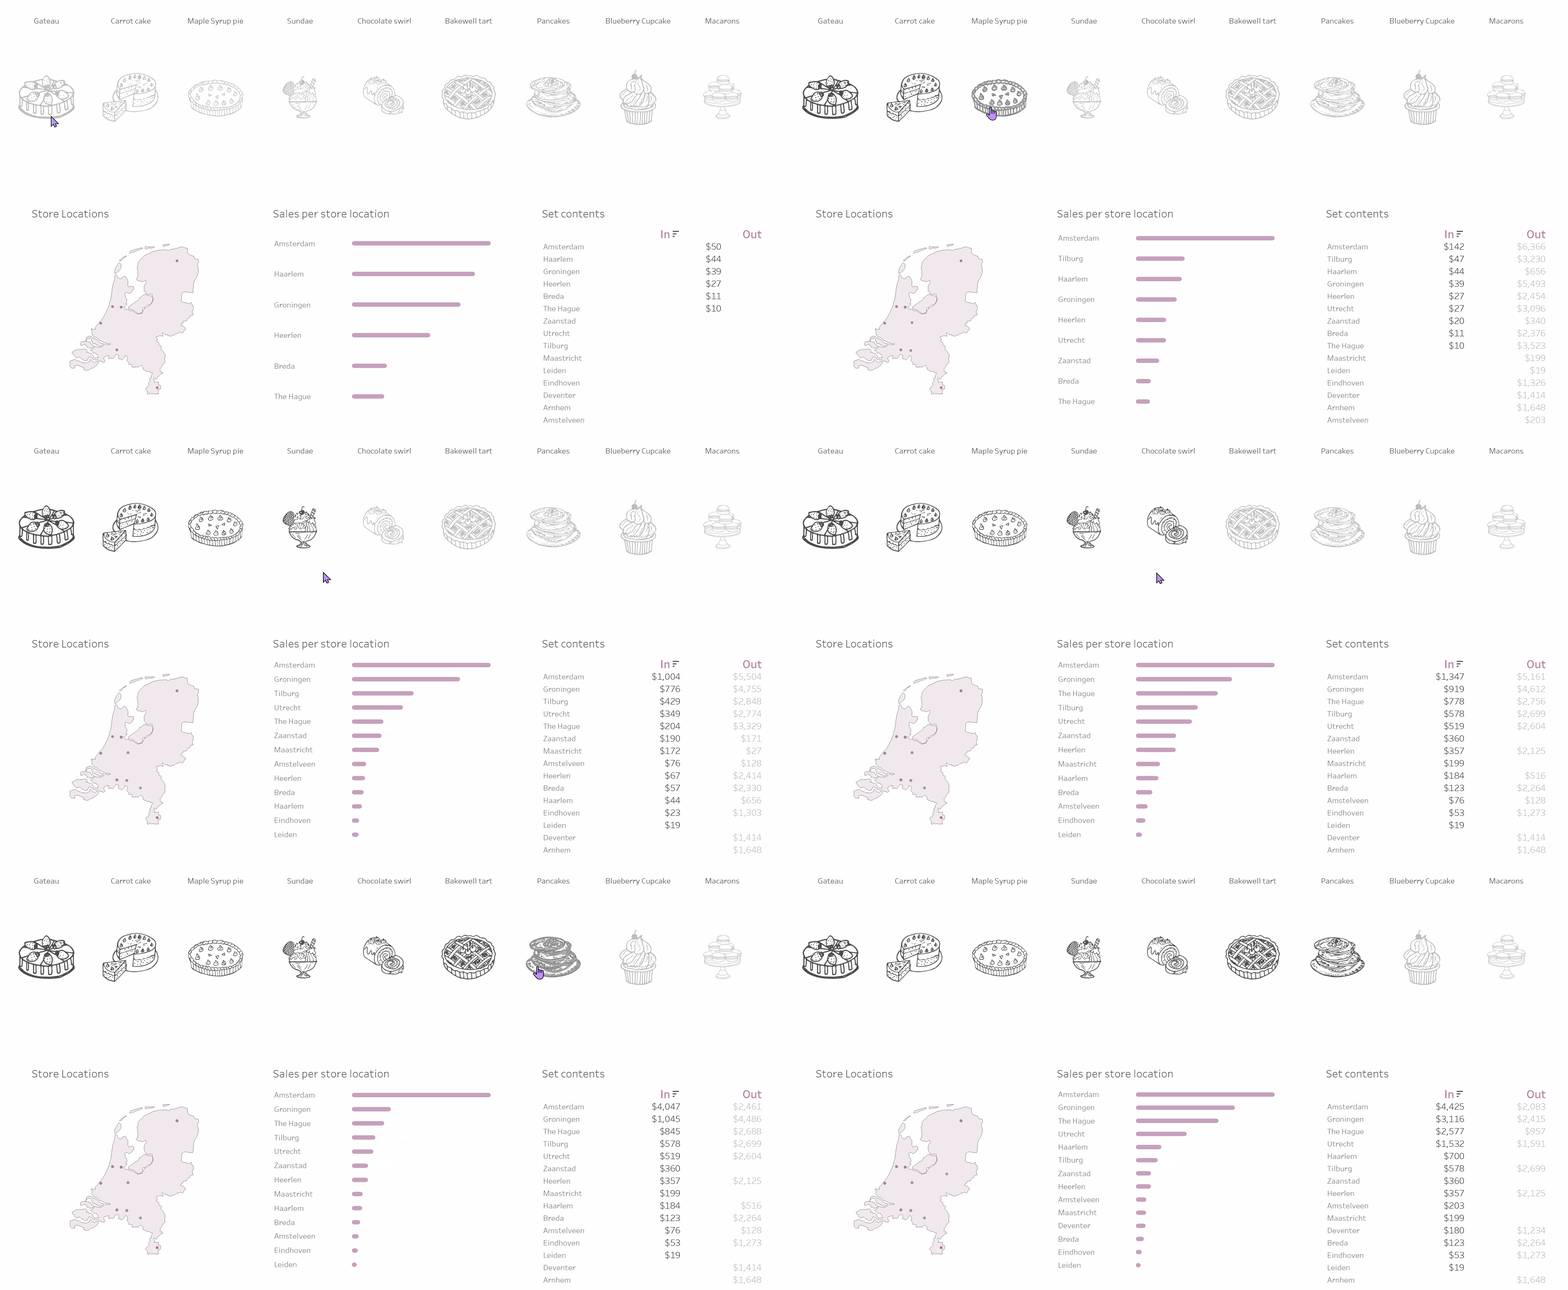
This option is useful if you would like to collectively add products to the set, whilst the other charts get updated with data from the most recent selection.
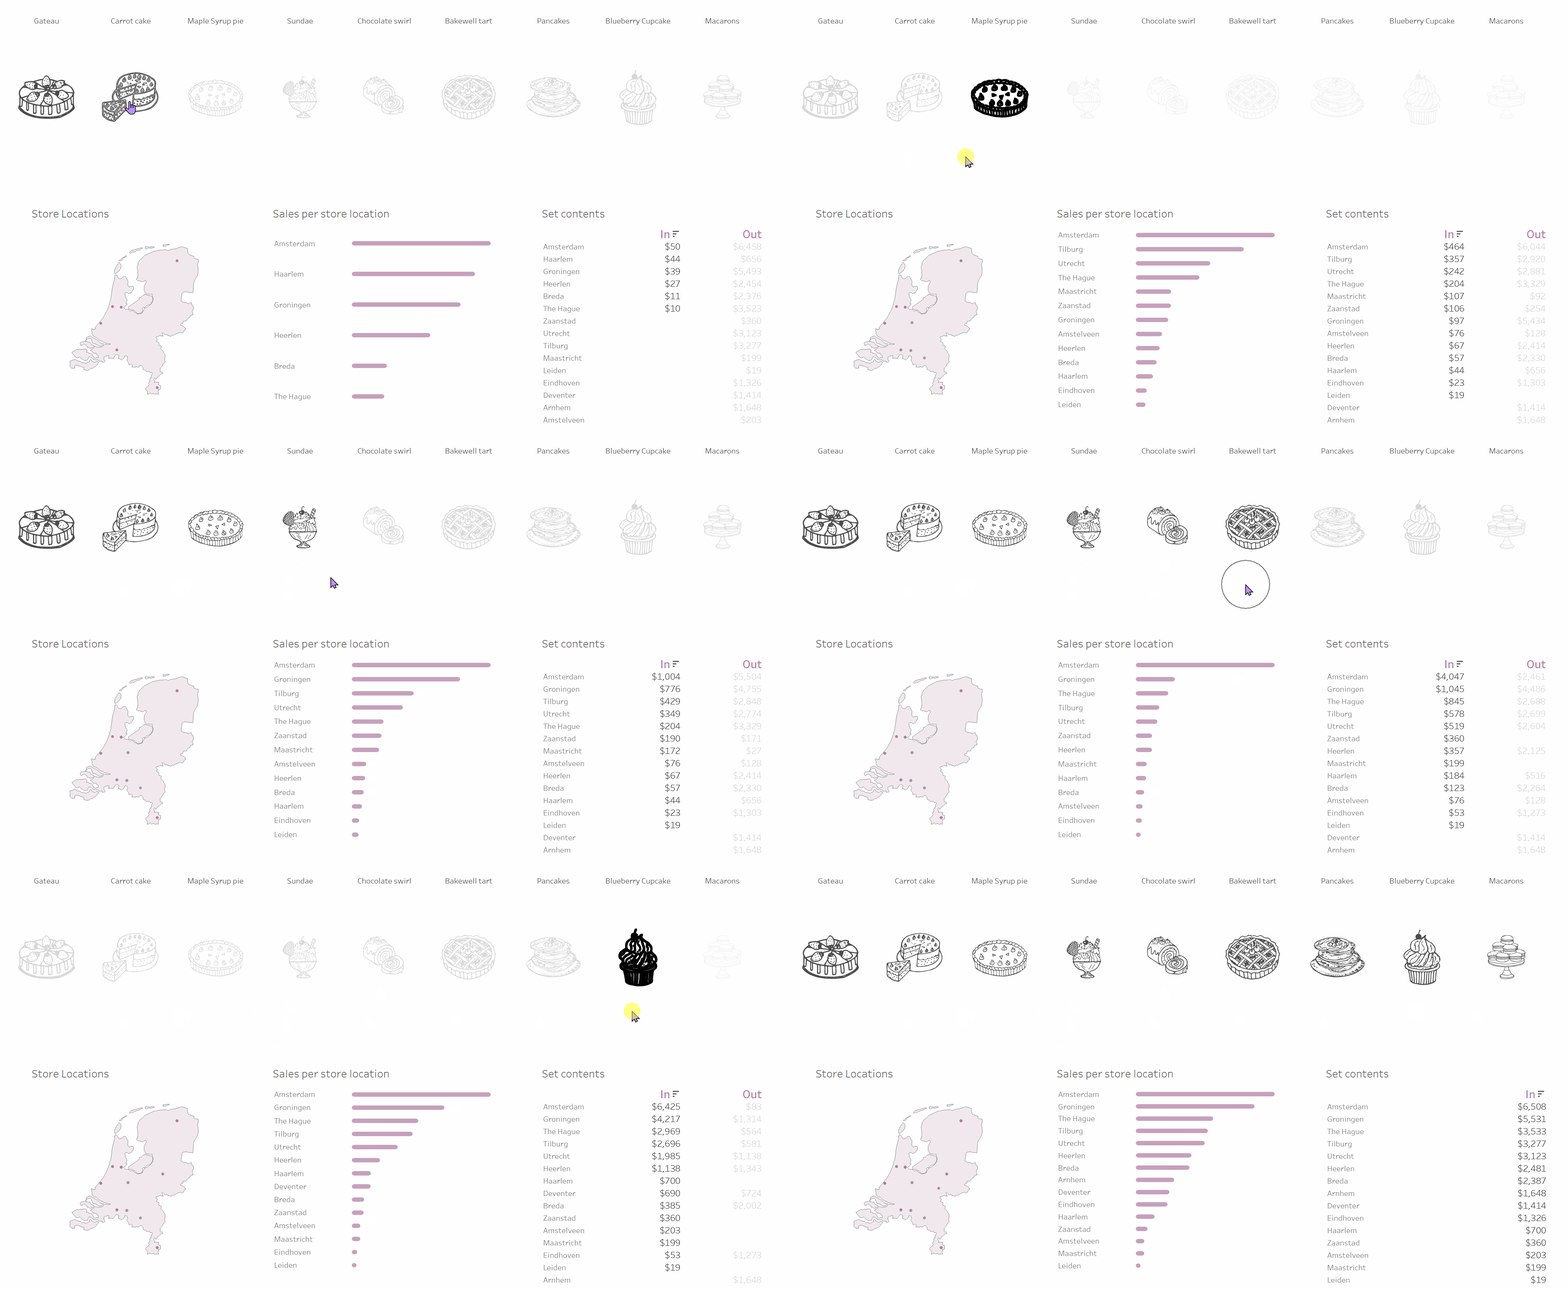
In the example below, each time I click on a new product, I can see which locations all my selections cover and the sum of sales for all products combined. Notice how the sales values are increasing for each city under the 'In' column:
3. Remove values from set
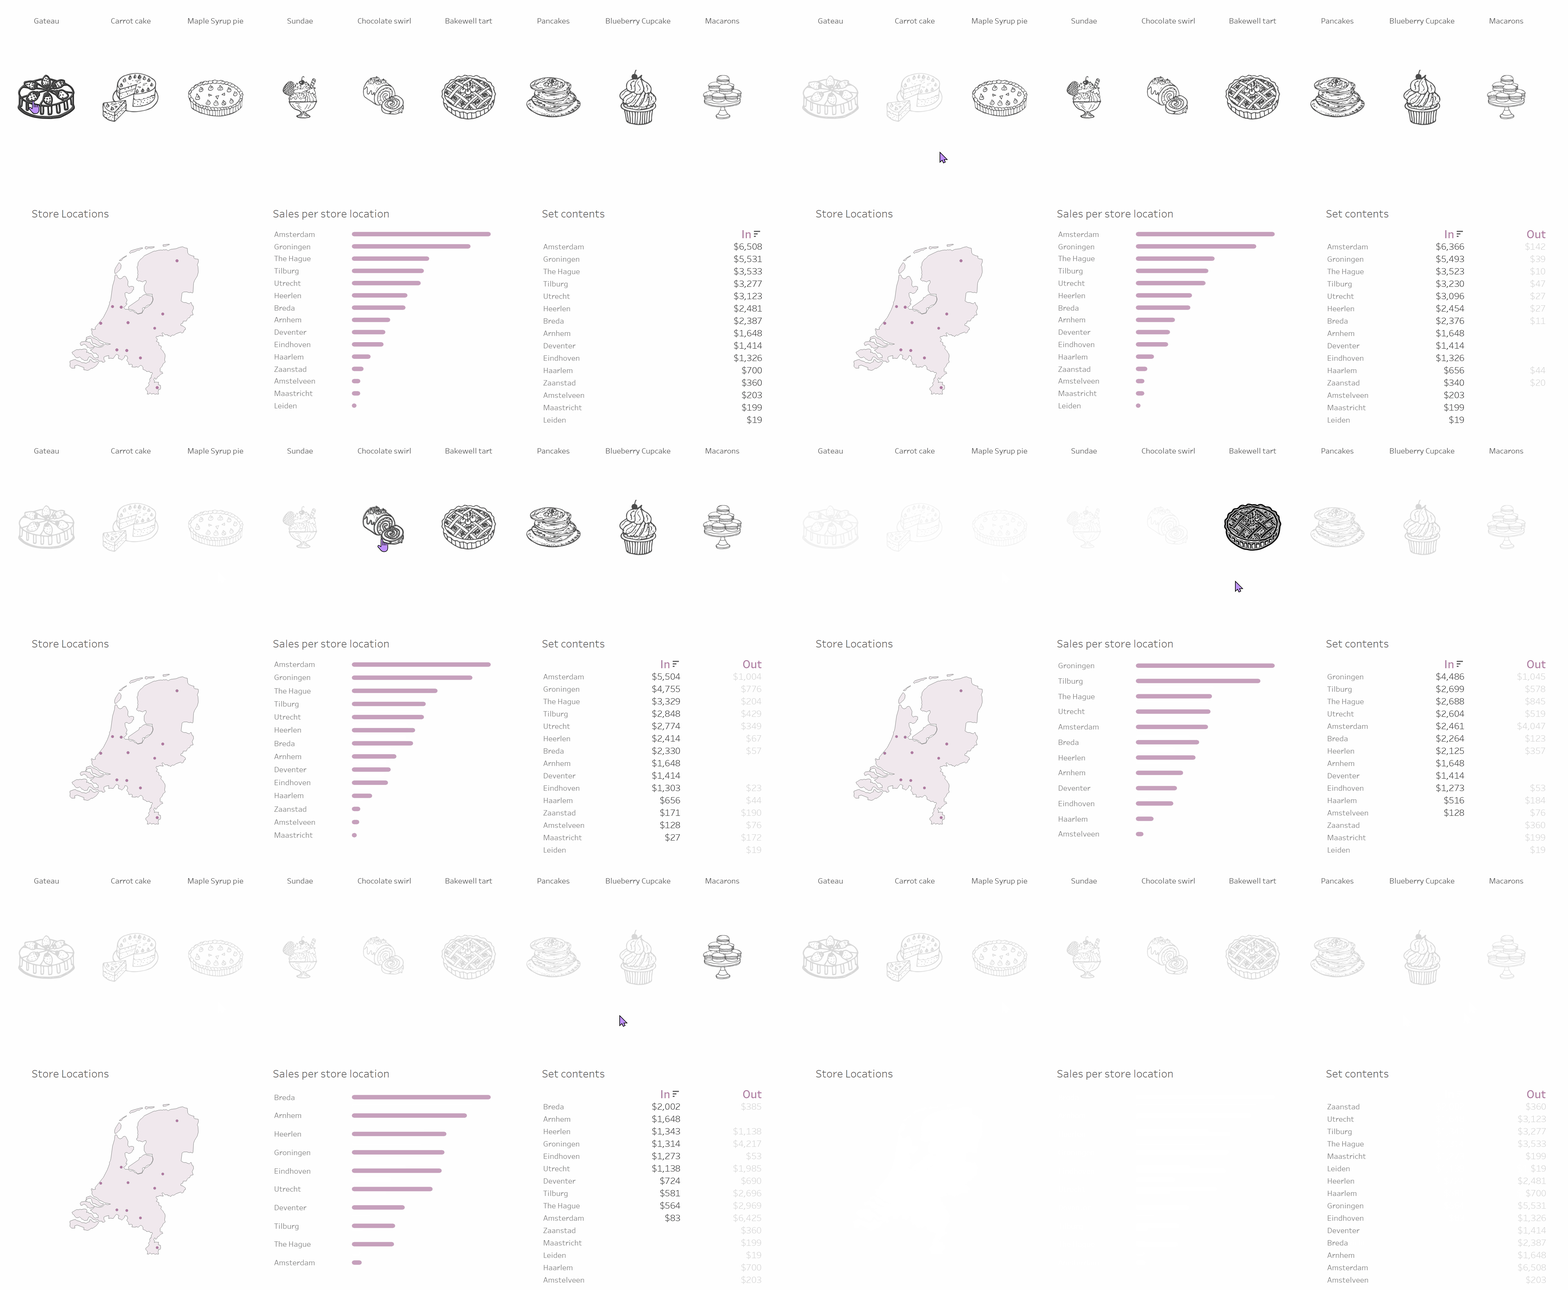
This option is useful if you would like to analyse your data by excluding certain elements from your dashboard. Selecting each product will remove corresponding data from the store locations and sales charts. Notice how the sales value for each city is decreasing under the 'In' column:
Clearing the selection will…
1. Keep set values
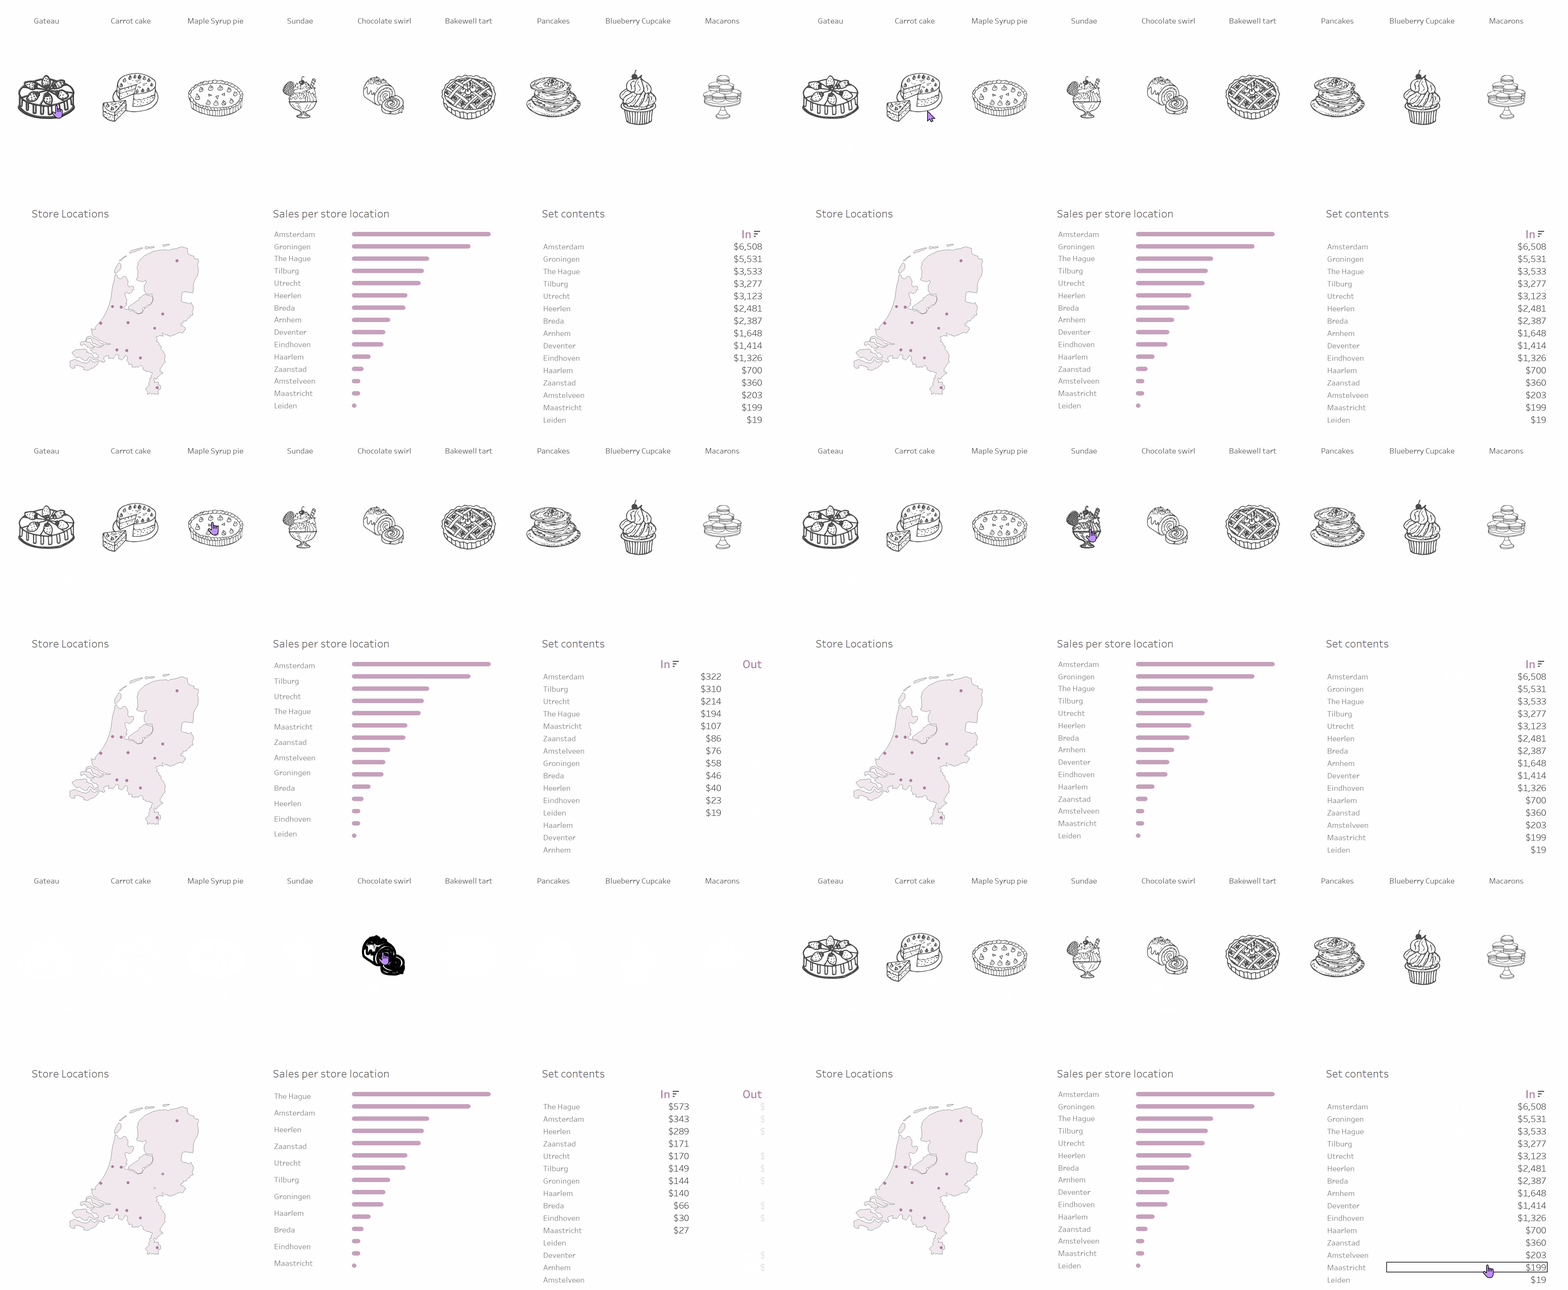
Use this option if you would like the data in the view to remain intact, even when you clear the selection (click away from a mark). Here, the run action is set to add values to the set, as I select each item and then clear the selection, the products appear darker, indicating that they are in the set, and the corresponding data remains unchanged whenever I clear the selection:
2. Add all values to set
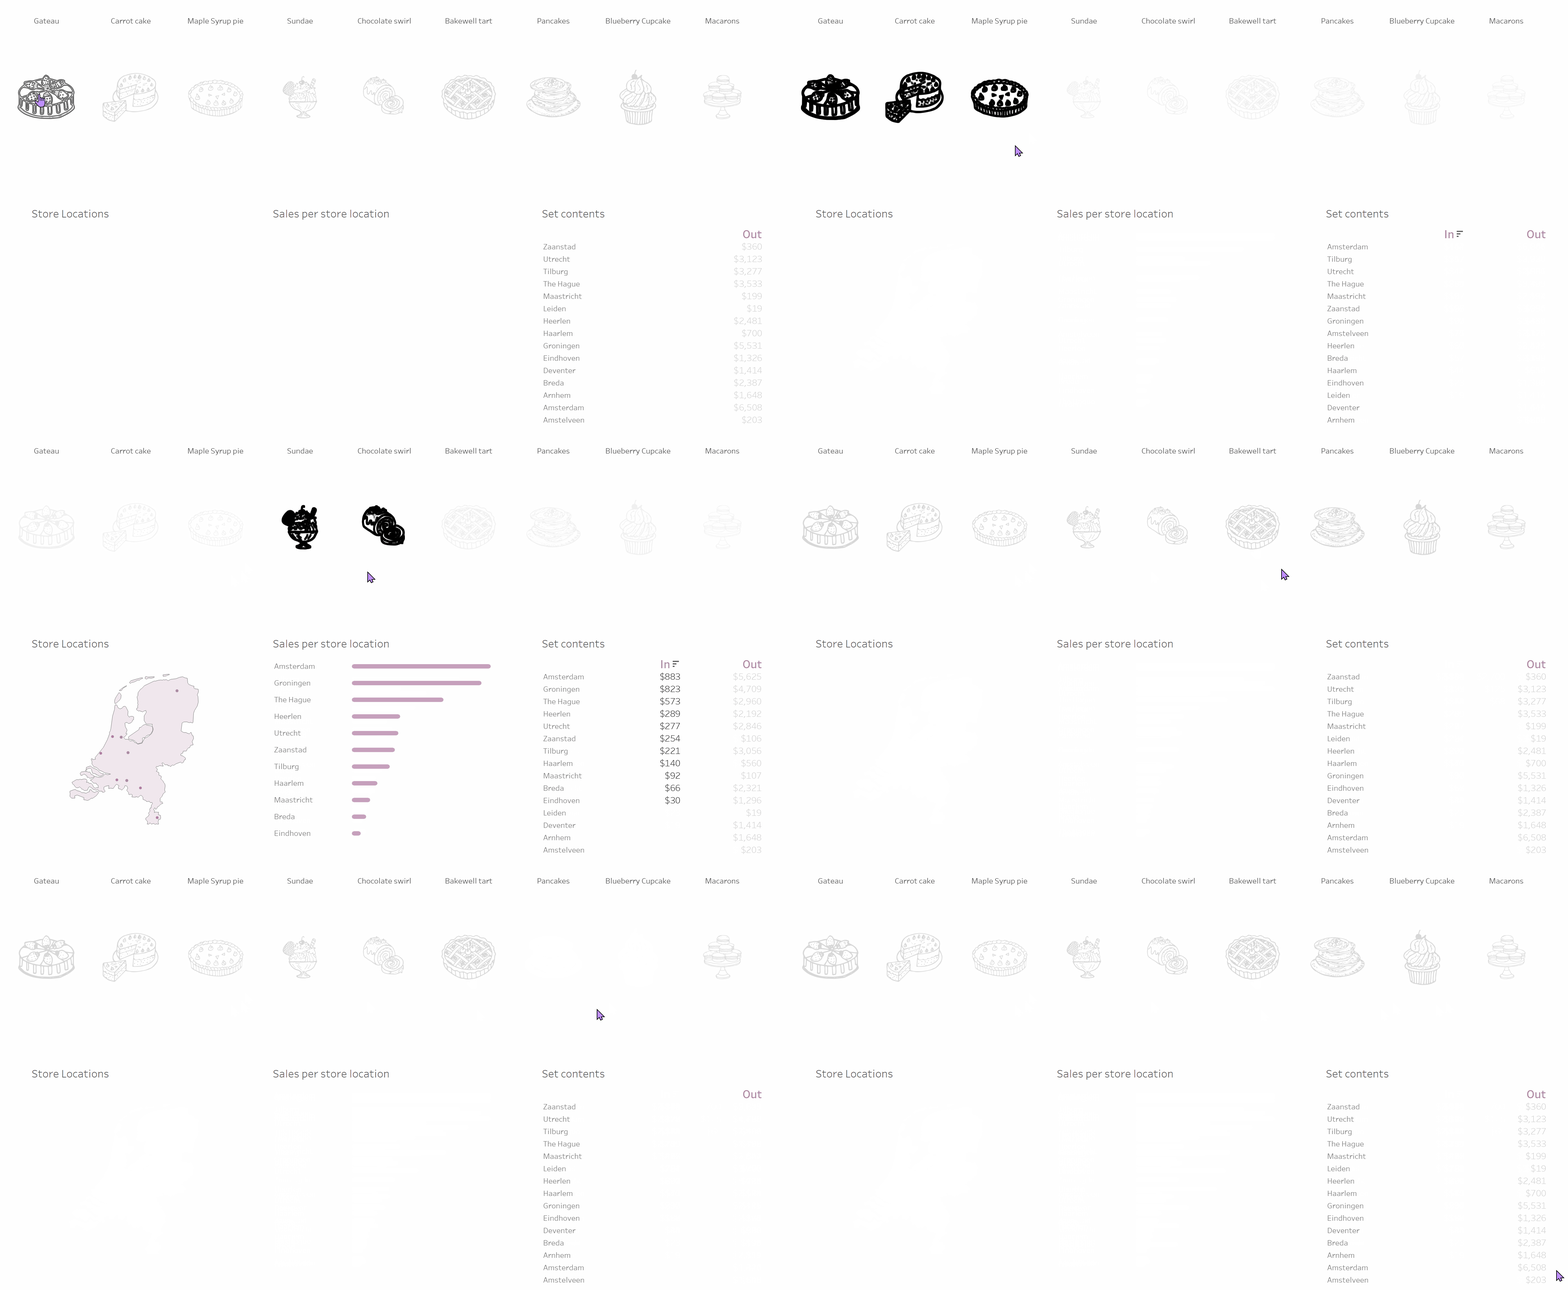
Use this option if you would like your dashboard to default to a fully populated view after clearing the selection. The run action is set to assign values to set, so I will only get data per one selection, however, when I clear the selection, the dashboard will default to my original view where data for every product is shown:
Combining Options
In the clearing selections examples above, you may have noticed the following combinations:
Running the action will: & Clearing the selection will:
| Add values to set | Keep set values |
| Assign values to set | Keep set values |
| Add values to set | Remove all values from set |
Another possibility is to:
&
| Remove values from set | Add all values to set |
This will allow the view to become fully populated after removing values from the set:
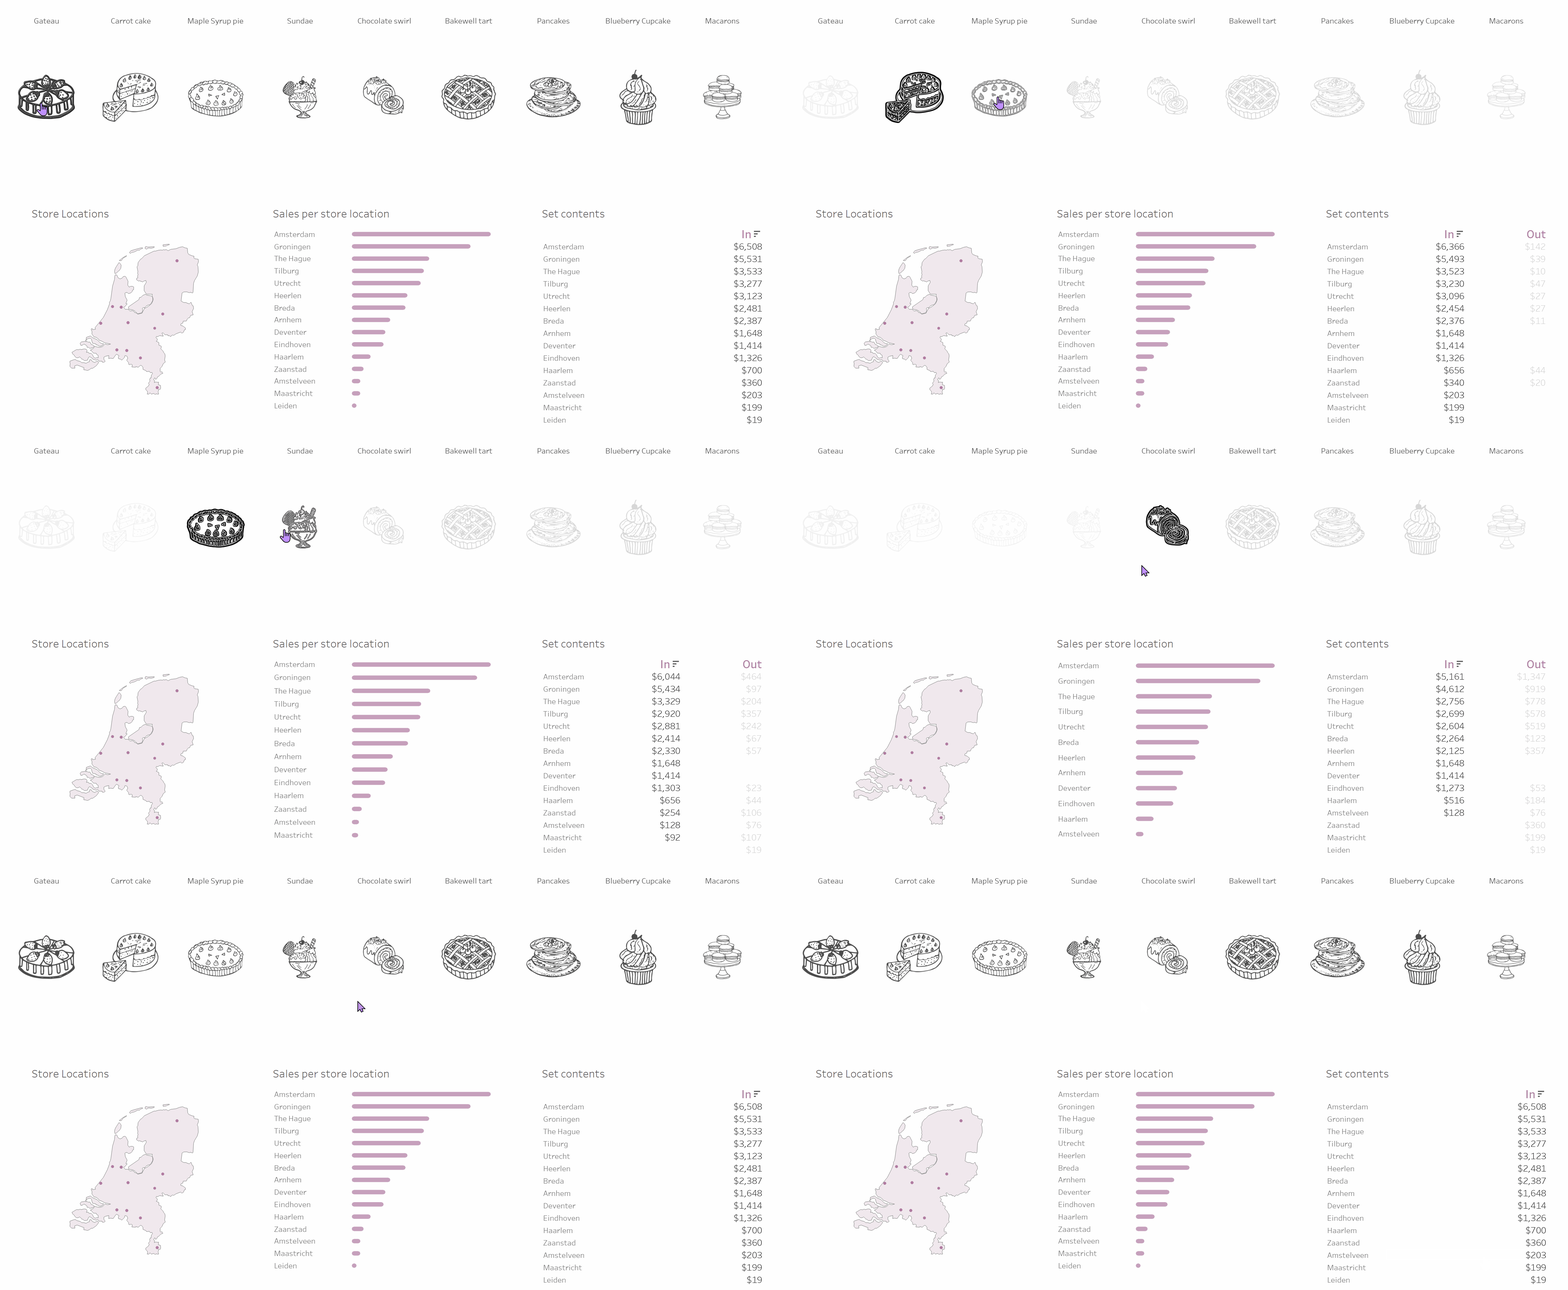
It is worth trying the different combinations to find out what works for your analysis and visualization.
Now that you have a better understanding of the set action dialog box, feel free to experiment and take your knowledge of set actions further!


