What is the Data Maturity Flywheel?
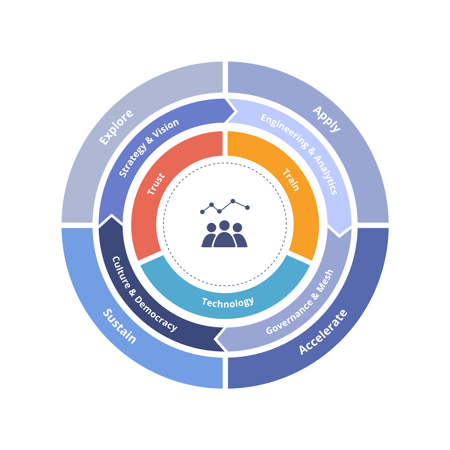
The Data Maturity Flywheel is Biztory’s remixed version of data maturity models and aims to explain the momentum you gain when you build your business on data, and align your entire organisation around a data culture.
It is a remarkably easy way to explain what’s at the core of your data journey - and that happens to be pretty important when thinking about your data strategy. Here’s what it looks like:

Most data maturity models think of data or data maturity as an outcome of their data journey - nothing more, nothing less. We don’t. We view your data and the level of data maturity by which your people interact with that data, as the driving force on which you make valuable decisions to build your business.
When you look at business data as a flywheel, you make different decisions and adjust your entire data strategy. To show you what we mean, let’s take a deeper look at how the flywheel actually works…
How does the flywheel work?
The level of data maturity, or the amount of analytics momentum, your flywheel contains depends on three things:
- The level of trust in your organisation and how trustworthy or accurate the data is
- How well people are trained and empowered to work with data
- The Tech Stack you are using to build your flywheel
The most data-driven organisations will adjust their data strategies to address all three. The speed of your flywheel increases when you add force to areas that have the biggest impact. Forces are programs, tools, strategies and other implementations you leverage to speed up your data maturity flywheel.
For example, a data quality audit, a consultancy program, and investing in your team with tool-specific training are all forces you could apply. By focusing on how you can make the people in your company work better with data, the more likely they are to make business decisions informed by data and impactful analytics.
Since you’re using forces to make your flywheel spin harder, you want to make sure nothing is opposing it - that means: eliminating hurdles from your data strategy. Hurdles are things that slow down your flywheel. Think of poor data quality, miscommunication between teams, a lack of understanding the data, and so on.
You can remove these hurdles by mapping your current data processes and how your teams are structured. Why is data quality poor? Is your data centralised or in separate data silos? Are all your teams aligned on where this data is coming from? Do they understand what the data means?
The more you increase speed and eliminate the hurdles, the faster you’ll grow on your data journey. And the faster you’ll achieve higher levels of data maturity.
Now, let’s take a look at each layer of that flywheel.
The Core: 3 Pillars to accelerate your data maturity
The flywheel approach is a means to an end. It’s a methodology you use to accelerate your data journey.

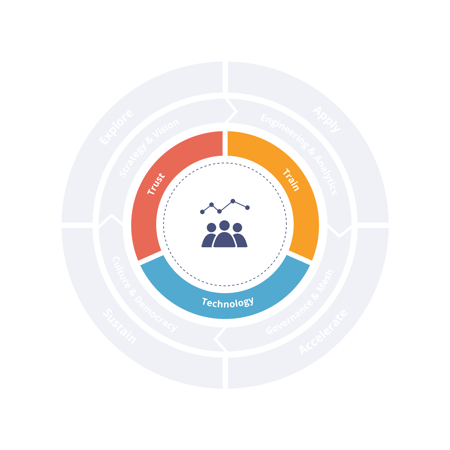
Looking back at how the flywheel works, you can translate your level of data maturity or analytics momentum into three core pillars of the flywheel:
- Technology: The Tech Stack you are using to build your flywheel
- Training: How well people are trained to work with data
- Trust: How trustworthy and accurate your data is
With people & data at the centre, these three pillars around the core are essential to making your data journey a success using our flywheel methodology.
So, how does that work?
Trust is all about data and culture. An organisation must not only be able to trust their data quality, management and security. It's also very reliant on the culture of how the data is perceived. Working on branding, creating internal communities, and creating a democracy data culture.
Training puts the emphasis on elevating your team and making them as data-savvy as possible. You can have various training programs both on the technical as well as the functional side. Biztory developed a best-in-class Learning Platform including live support and Consultant Doctors you can book alongside the training.
Technology focuses on every single piece of software that is used in your organisation. By mapping your today's architecture, we can advise you on how to get the best out of your current stack, and advise you on what we refer to as the Modern Data Stack.
We believe true analytics momentum is achieved when you put these things into motion with a tailored approach for your organisation.
Centre wheel: Areas that define your data maturity
A data journey typically evolves around the specific areas that ultimately define your level of analytics maturity.

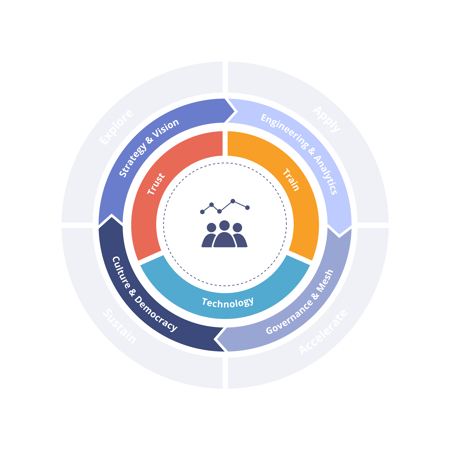
There will always be overlap (hence the circular shape), but there are 4 main areas to consider:
- Data Strategy & Vision
- Data Engineering & Analytics
- Data Governance & Mesh
- Data Culture & Democracy
Now, let’s dig a little bit deeper in each area of the middle layer of the data maturity flywheel…
Data Strategy
A data strategy is your long-term, guiding plan for how your organisation will leverage data in support of making business decisions.
It goes beyond simply the use of your data. It should cover processes on how to make your data trustworthy, how to train people so they can get answers from data easier and faster, and which technologies you’ll use to support this.
Building a vision for data within your organisation provides you with a sense of direction. What is it you’re looking to achieve? What challenges are you facing today? Think of it as the roadmap for the data journey of your organisation and how to achieve your data goals using this flywheel methodology.
Read more about defining a data strategy for your organisation here.
Data Engineering & Analytics
Data Engineering & Analytics is all about empowering people with impactful data at their fingertips. Giving them the right tools, skills and knowledge to make better data-driven decisions.
Firstly, you want all your data to be centralised in one place - like a data warehouse. To move data from the source to your data warehouse, you need data pipelines. Building them can be pretty complex and probably will require some engineering skills.
Once the data is there, you’ll need to determine how you will clean and transform raw data to prepare it for analysis. Whether you like it or not, your data is probably a bit messy.
After your data is collected, stored securely in a warehouse, and prepared for analysis - it’s time to start visualising your data in analytics platforms.
Data Governance & Mesh
This is where trust comes into play once again… Making sure people get the right data at their fingertips and know it is trustworthy. Also known as: not having them ask for another excel file to double check on the results that are displayed in a dashboard.
Data governance is closely associated with data quality improvement efforts and is a critical component of effective data management strategies, especially in organisations with distributed data environments that include a diverse set of systems.
Data Culture & Democracy
Aaah… Data to the people!!
Data culture is all about data democratisation and building a sustainable future for data-driven decision-making.
Building that data culture requires more than just having the right toolstack in place. It is driven by an organisational focus on cultural change throughout the company.
In fact, having a company-wide data culture in place is the one thing that will really matter when the new tools you choose are getting old, and that one data project you’re looking to solve now is already long forgotten.
Read more on how to build a winning data culture here.
Outer wheel: Accelerating your data journey & maturity
I know what you’re thinking right now: “what in Gandalf the White’s name is the difference between the flywheel and the data journey? They look the same.”
And you’re right. They might look the same, but they’re not.
Your data journey are the different stages you go through on the road of growing digital analytics maturity within your organisation. It’s a roadmap that consist of 4 different phases:

Phase 1: Explore
This is where you engage with your data and define relevant use cases for your business. During the engagement phase, you basically discover the possibilities of data, learn the added value it can bring to your business and find ways to optimise your internal data processes.
Clear challenges require clear objectives for them to be solved. So the engage phase is mostly focused on identifying specific data challenges or use cases and building a strategy on top of the challenge to overcome.
You basically find out where the problems are: Is your data accurate? Are the people within your organisation data literate or data savvy? Is your data stack infrastructure future-proof? What does your data architecture look like?
Once problems have been identified and linked with possible solutions, it’s time to put things in motion with phase 2.
Phase 2: Apply
This is where the action happens. In this stage of your data journey, you start implementing the different tactics of your data strategy. This is where you adapt to what you’ve learned in the Engage stage.
Redesigning your data architecture to build smooth data pipelines to your cloud data warehouse using Fivetran & Snowflake for example, could be one of the things you’re implementing. If the main challenge is data quality and governance, working on data lineage, security and definitions to keep your data fresh might be another tactic you’re working on at this stage of the journey.
Phase 3: Accelerate
Once you’ve laid a foundation that is solid. It’s time to speed things up. Enabling more users to work with data and to make business decisions based on impactful analytics is a way to boost your growth on this journey.
This is where extra pairs of hands come in handy. The more people are able to work with, the faster you’ll achieve your next level of data maturity. But sometimes, these people need a little bit of help to get on their way when using new tools or working with different data sets.
Consultancy programs are therefore a great accelerator for the future data heroes in your company.
Phase 4: Sustain
They say the reward is in the journey, not the destination. And even though that’s mostly true, you don’t want all your hard work to be for nothing.
In this final stage of the cyclical process we call a data journey, you want to sustain what you have built and achieved over the last three stages. Doing proactive health checks on your modern data stack infrastructure, getting support on Server issues, or building an internal data community are some of the many ways to sustain the results of your journey.
Here, you help, support, and empower team members and customers to reach their goals with data.
You can download a full overview of the Biztory data journey here.
Next Steps
If you’re ready to build your business on data and go on an accelerated data journey with the Biztory Data Maturity Flywheel, we’ve got you covered.
There are three easy ways to make your first step and to get your journey started:
- Data Maturity Audit: A quick scan that assesses your current level of data maturity and data stack infrastructure. Based on your responses, our consultants can identify pain points that will help you find the quickest road to success. Request one here.
- Workshops & Labs: Already know what use cases and challenges you want to tackle first? Great. Our workshops and Labs (proof of concepts) are aimed to get you started in no time.
- Talking to a sales consultant: Getting your journey started can be overwhelming. Talking things through with experts on our team can already bring a lot of clarity on the scope of work, and what your journey might look like. Greatness comes from small beginnings, so why not just take a first small step?


