Hi All,
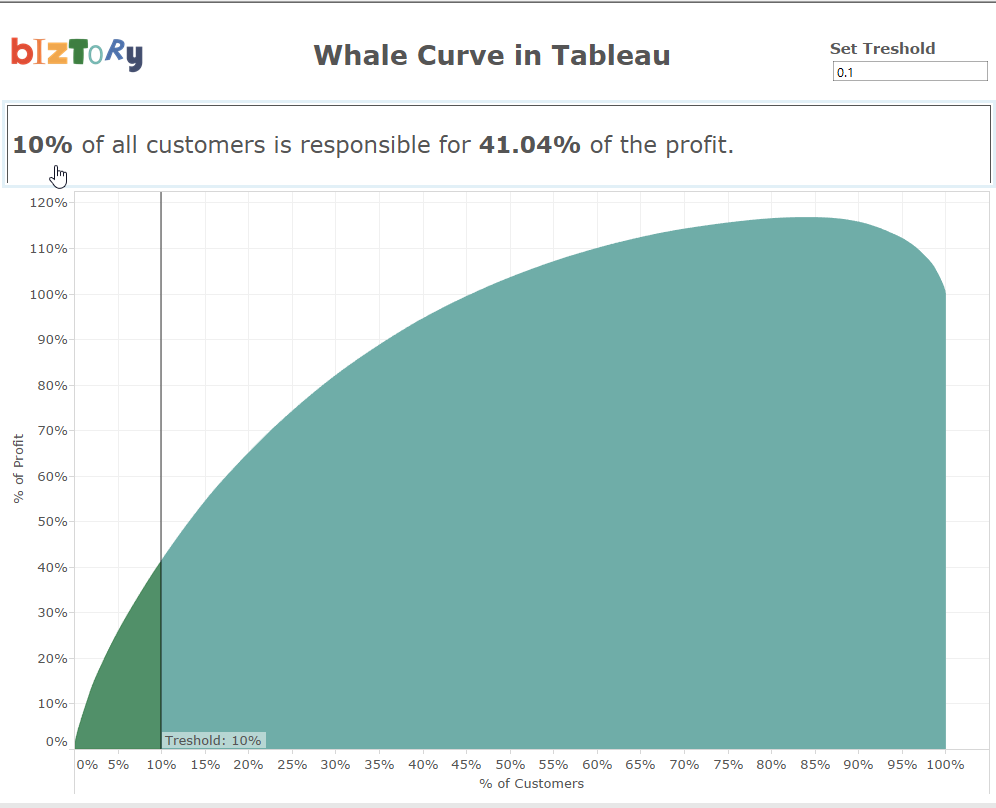
in this blog post, I will show you how to create a whale curve in Tableau. A whale curve is a similar graph as a Pareto chart however the whale curve is easier to interpret. You can easily detect which of your customers are the most/least profitable ones. I've got the question to create a whale curve in Tableau from a client and the results looked cool. Et voila, a new topic for a blog.
Step 1:
Drop Customer Name on detail and count distinct the Customer Name in Columns.

Step 2:
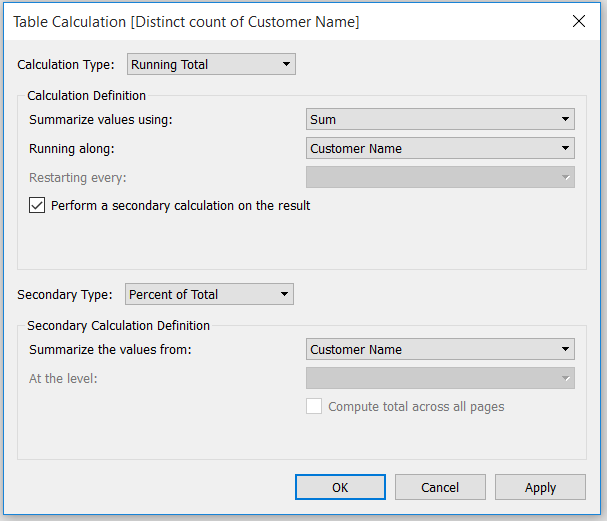
Add a table calculation on the count distinct of Customer Name. The table calculation should be a running total running along the Customer Name. Also perform a secondary calculation that is the percent of total summarizing along Customer Name.
Step 3:
Drop Profit on the Rows shelf.
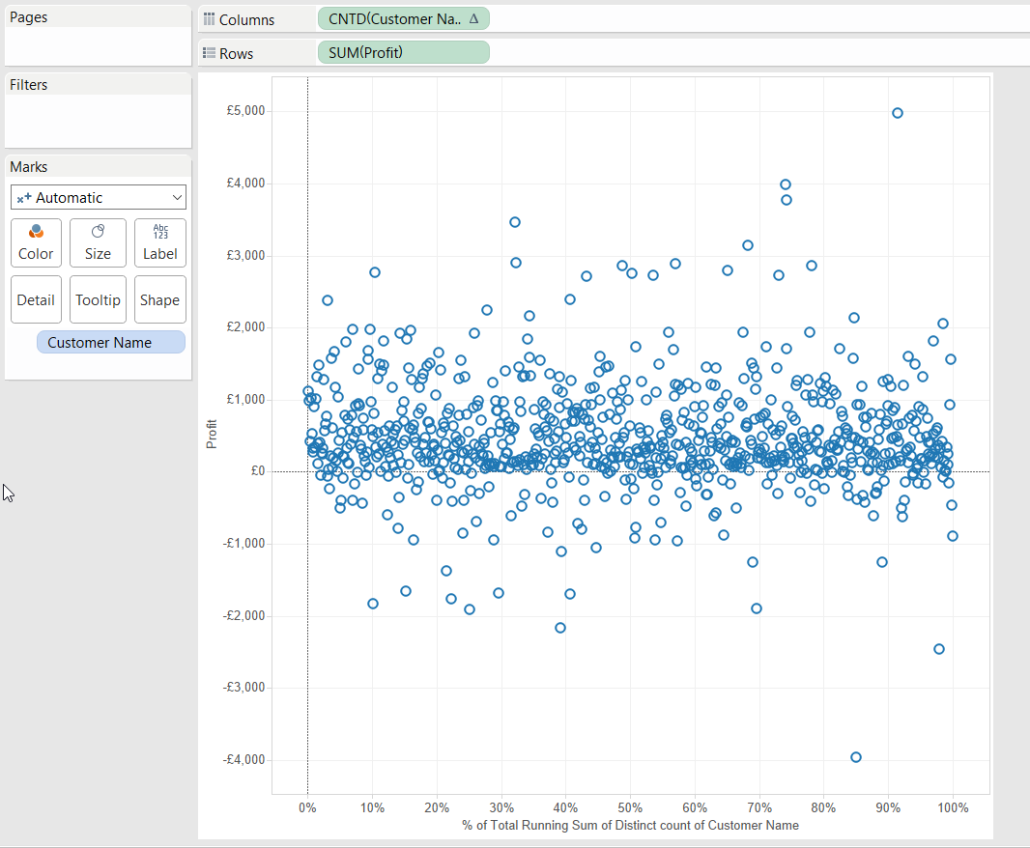
Step 4:
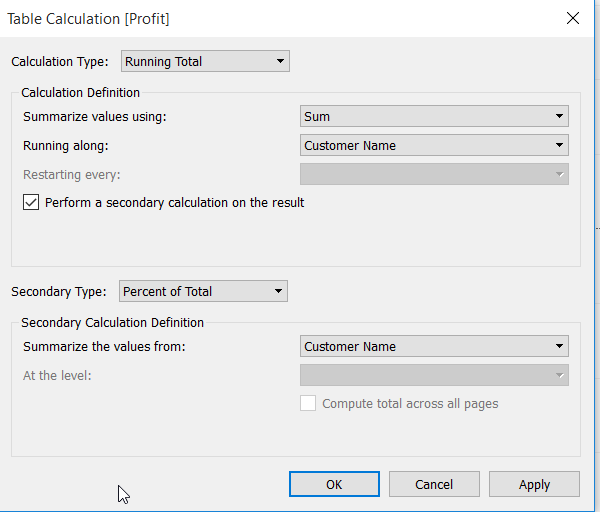
Add the same table calculation as in step 2 on the Profit tile.
Step 5:
You should get a similar result.
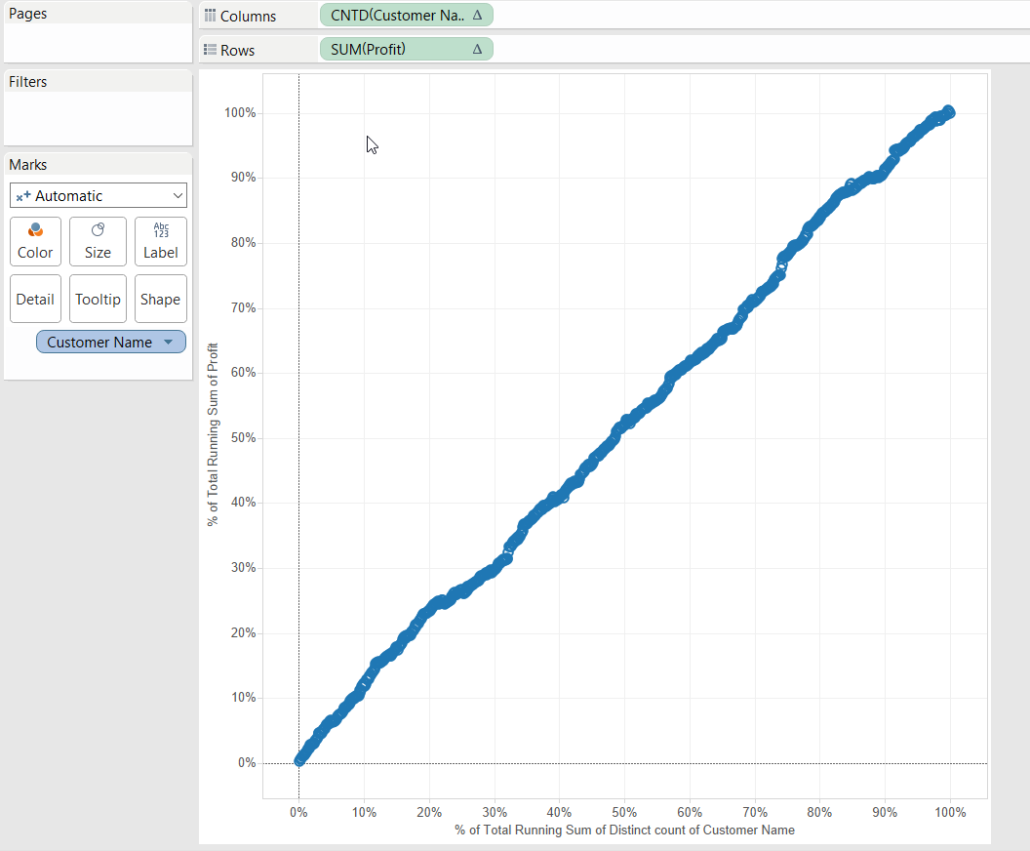
Step 6:
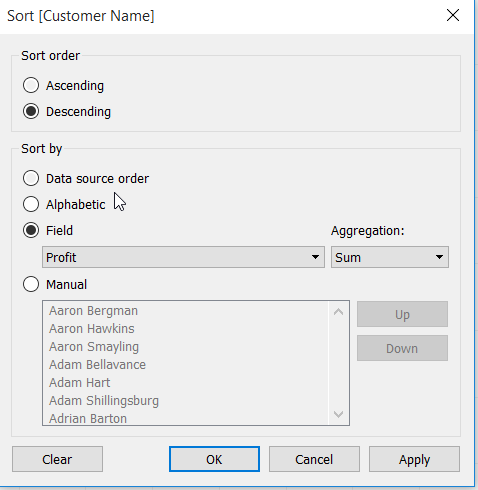
Sort the Customer Name on detail in a descending way using the sum of profit.
Step 7:
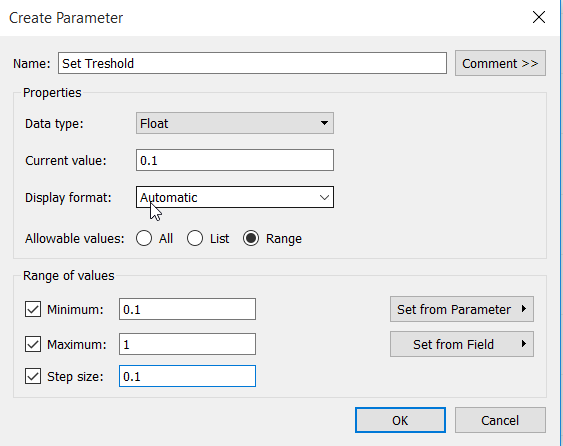
Create a parameter called "Set Treshold" as float going from 0.1 to 1 using a step size 0.1.
Step 8:
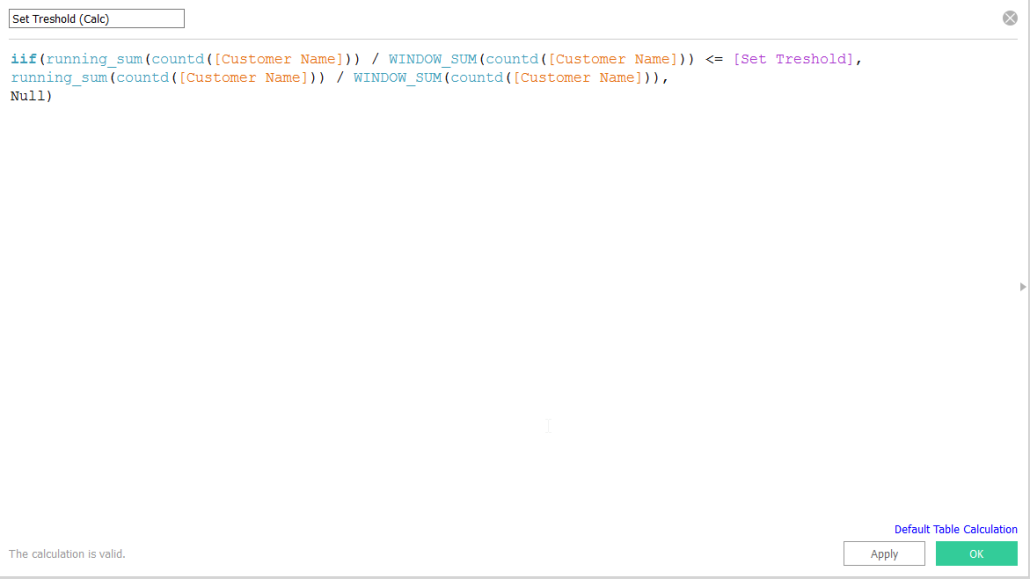
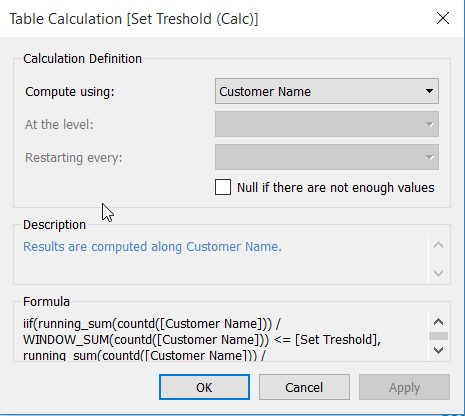
Create a calculated field called "Set Treshold (Calc)" using following fomula:
iif(running_sum(countd([Customer Name])) / WINDOW_SUM(countd([Customer Name])) <= [Set Treshold],
running_sum(countd([Customer Name])) / WINDOW_SUM(countd([Customer Name])),
Null)
Step 9:
Dual axis "Set Treshold (Calc)" on the Columns shelf and synchronize the axis. Make sure Set Treshold (Calc) is calculated using Customer Name.
Step 10:
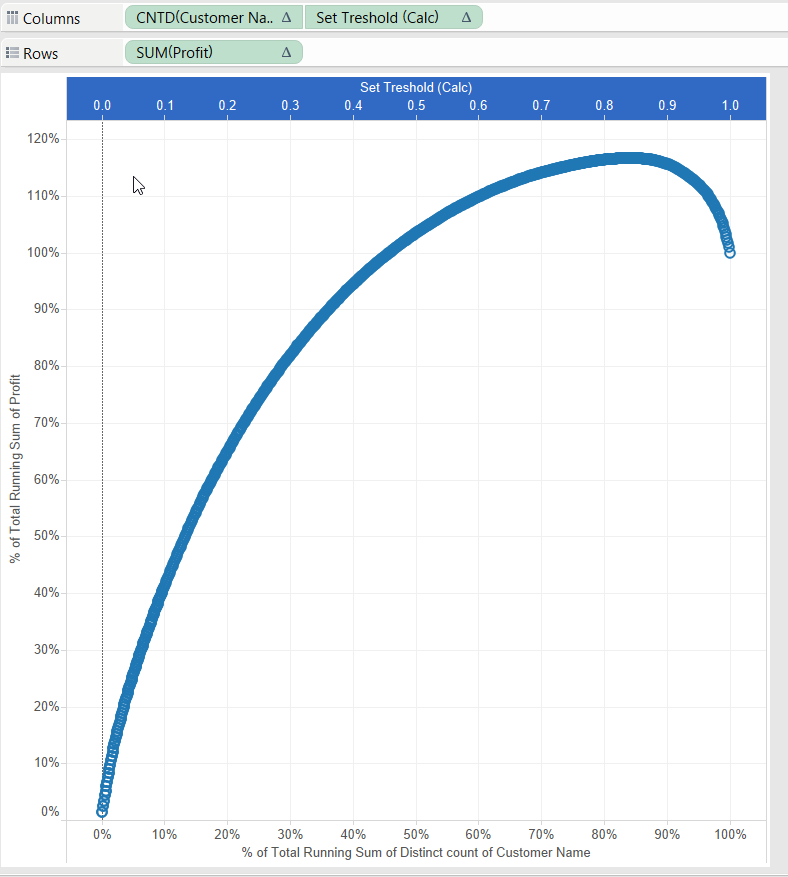
You should get a similar result.
Step 11:
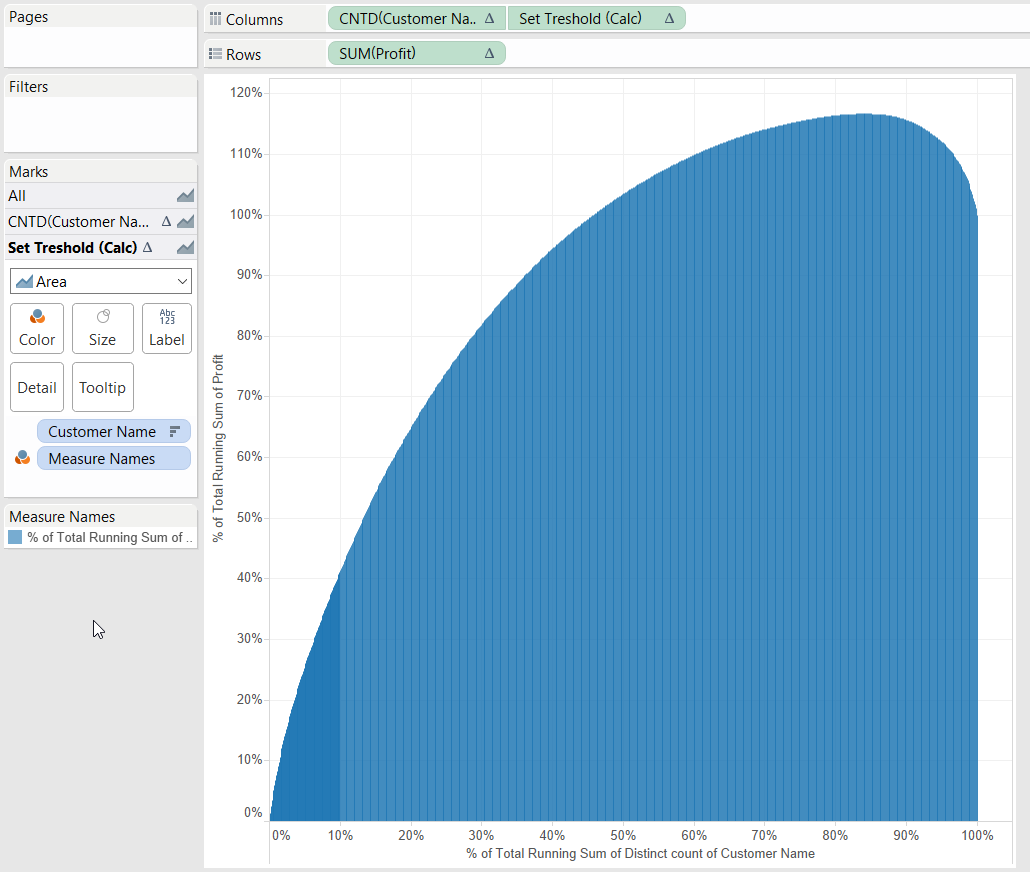
Set the graph type to area.
Step 12:
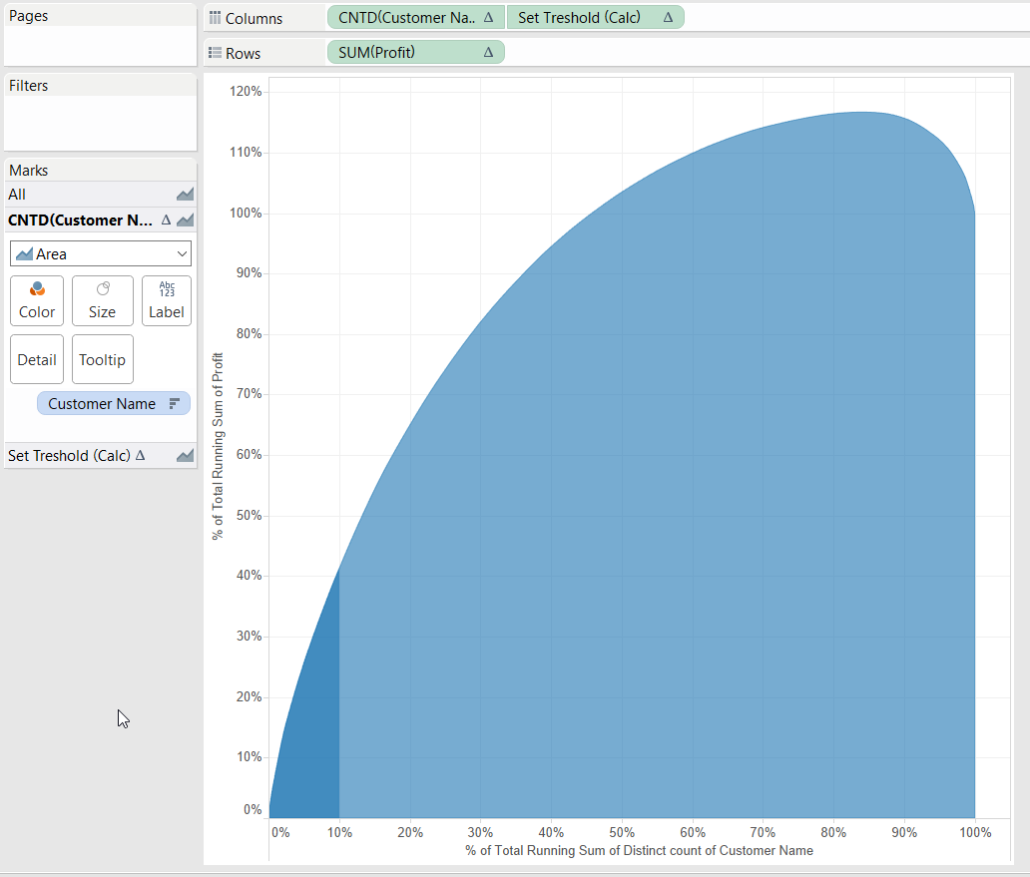
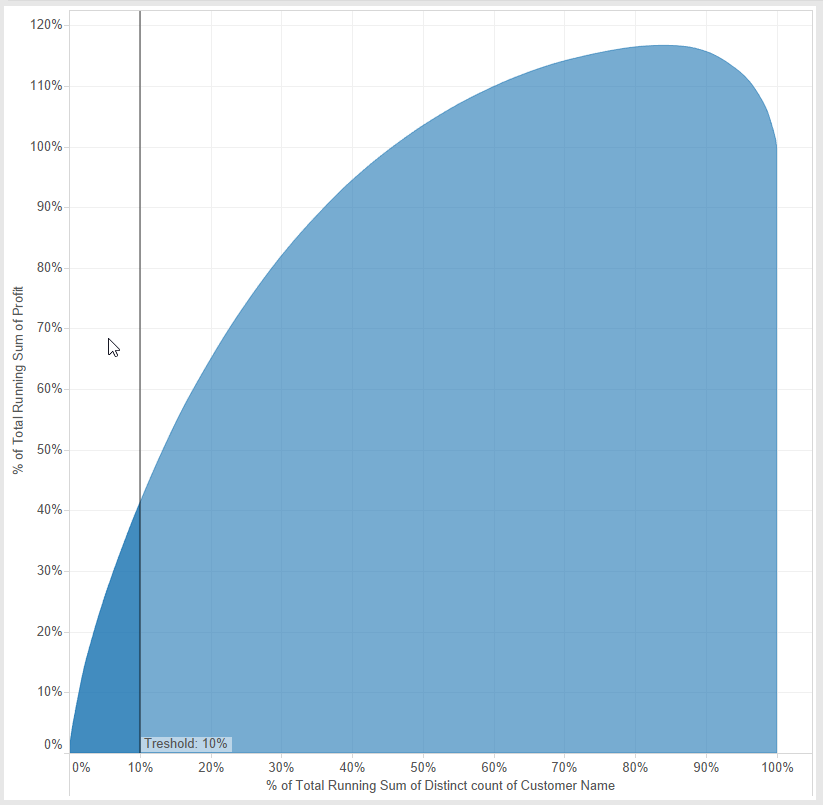
Remove the tile on detail called "Measure Names". Your graph should look like this.
Step 13:
Add a reference line using the Set Treshold parameter.
Step 14:
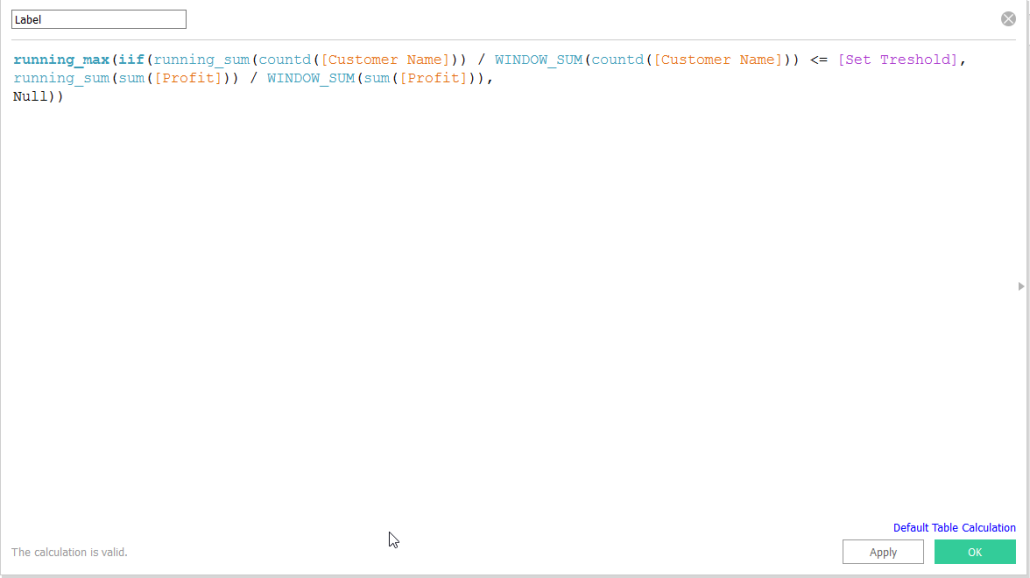
Create a calculated field called "Label" using following formula:
running_max(iif(running_sum(countd([Customer Name])) / WINDOW_SUM(countd([Customer Name])) <= [Set Treshold],
running_sum(sum([Profit])) / WINDOW_SUM(sum([Profit])),
Null))
Step 15:
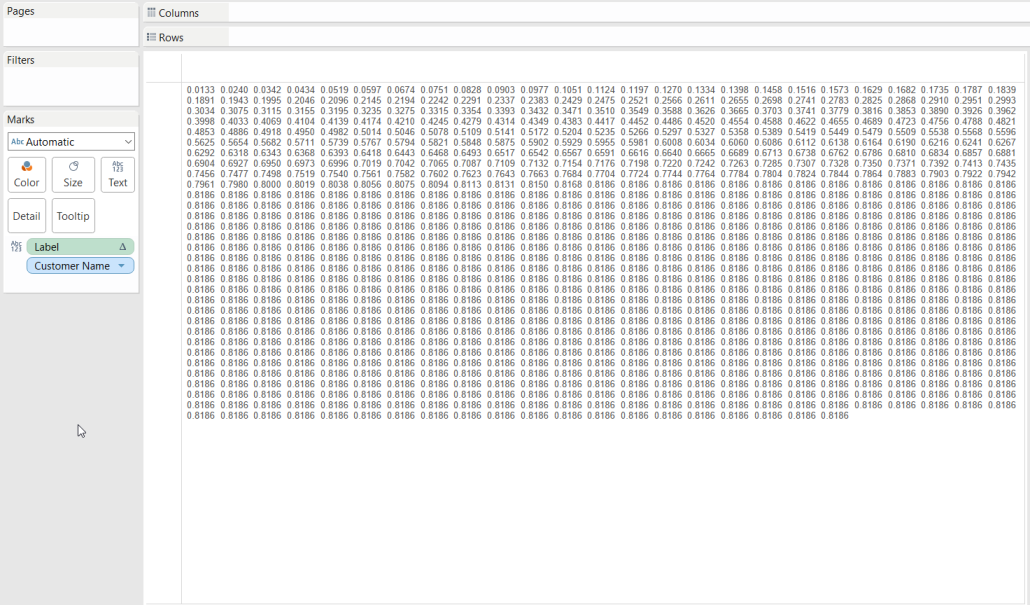
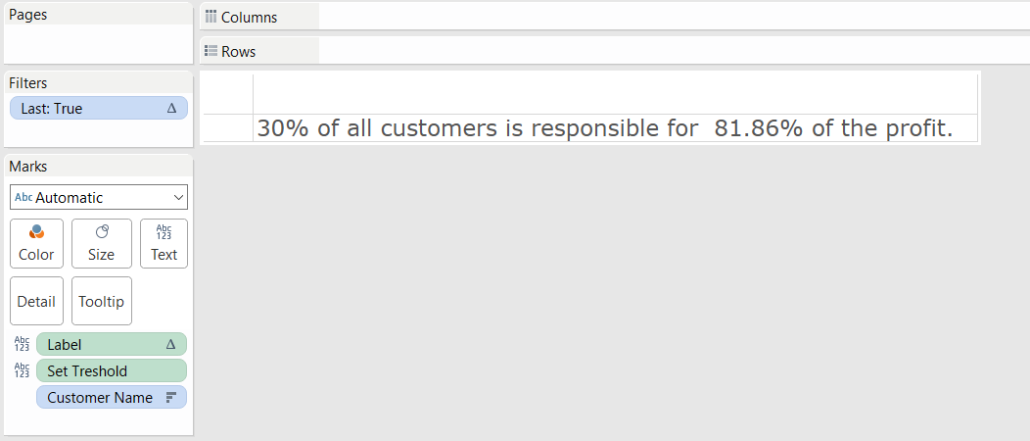
Create a new sheet and drop Label and Customer Name on detail. Make sure Label is calculated using Customer Name.
Step 16:
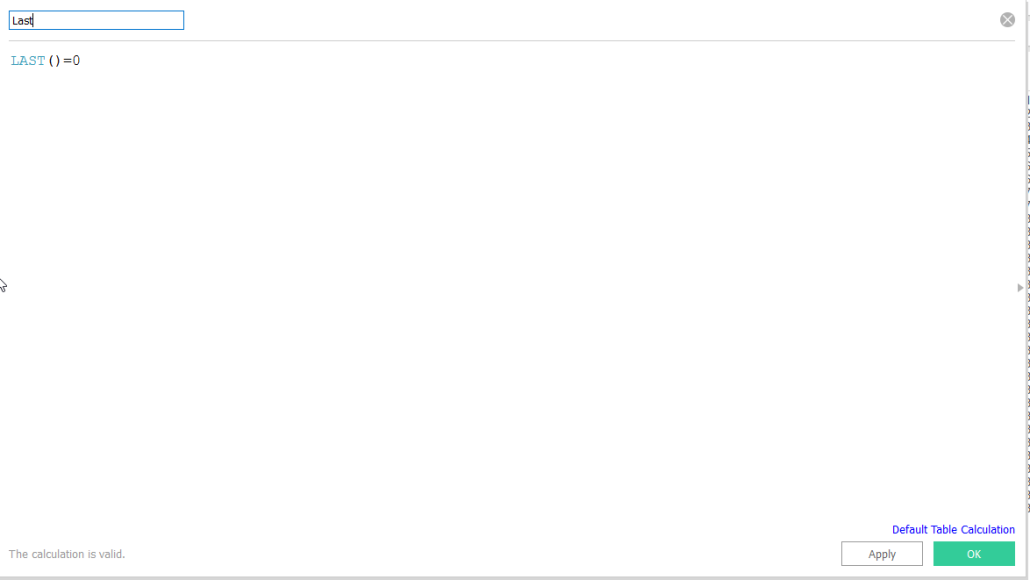
Create a new calculated field called "Last" using following formula:
LAST()=0
Step 17:
Drop Last onto the filter shelf and filter on True. Make sure Last is calculated using Customer Name! Also drop Set Treshold on detail. You should get a similar result.
Step 18:
Put the 2 sheets together on a dashboard. You should get a similar result. Click on the graph to go to the interactive version and download the Tableau Workbook.
That was it folks! I Hope this was useful.
Happy Analyzing!

