Hi all,
Yesterday I was checking different websites in search of a nice holiday location for next summer (just like half the population in Belgium during these gray days). It occured to me that an analysis for holiday locations could also be done in Tableau (duh, what can't be done in Tableau?)
I started by searching and creating an appropriate data set. Inside Air Bnb is a nice website where data sets can be downloaded from Air Bnb grouped by different cities. When I noticed data sets of Antwerp and Brussels existed (the two 'biggest' cities in Belgium), my enthusiasm only rose! The analysis was a fact!
Second step of the process was a quick visit to Tripadvisor in order to create a data set with the top tourist attractions in both cities. This data set was compiled in a traditional way with an Excel, Google Maps (for the coordinates) and a browser window with Tripadvisor. Data scraping is for lazy people!
Using Alteryx (and specially the spatial package in Alteryx), the data set for the Tableau visuals was born.
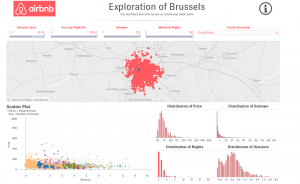
After a day of pure fun in Tableau, the result is there. Hope you guys enjoy it!
I will write a blogpost on how the distance to different points is calculated in Alteryx but for now, I wanted to share my enthusiams with you.
Feel free to share!


