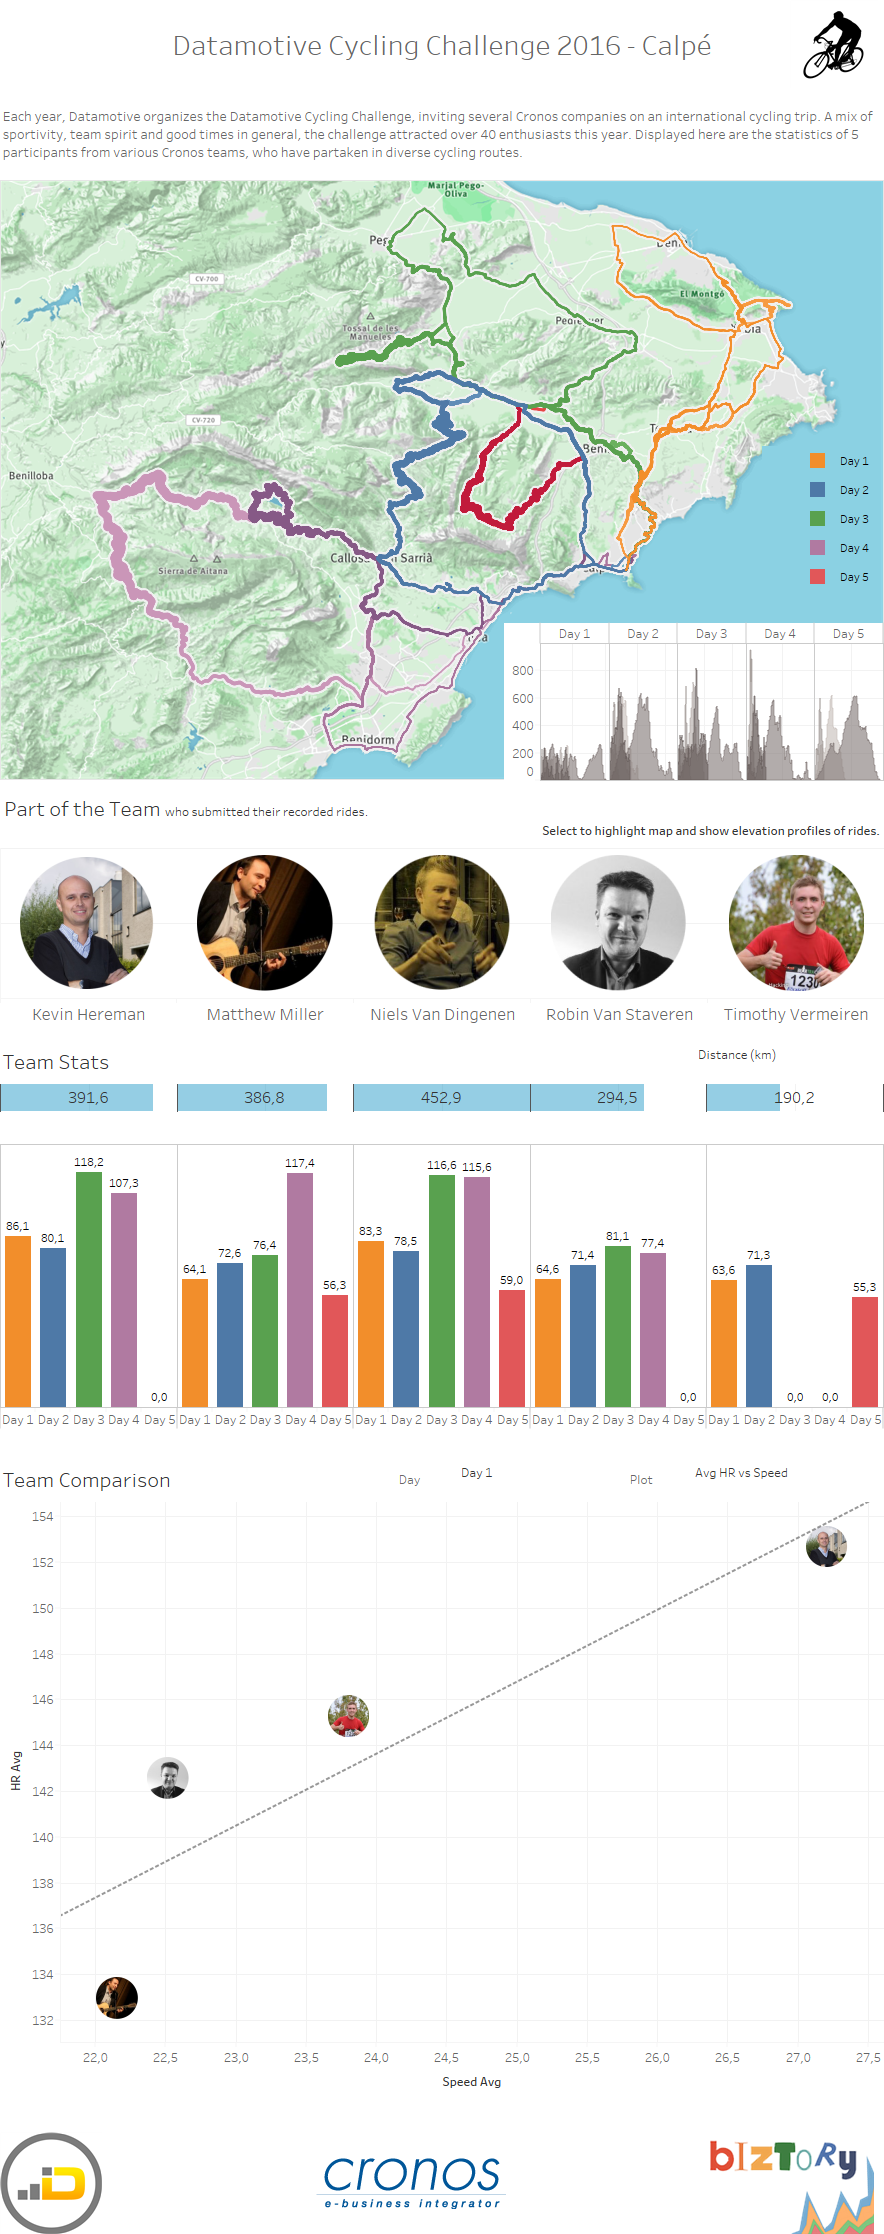
So, two weeks ago, we went on a 5-day cycling trip with some of our Cronos colleagues. In Calpe, South of Spain, we measured ourselves against the challenges presented by the yearly Datamotive Cycling Challenge.
As a true Viz fanatic, this obviously meant... Fresh data! Most participants used one or multiple devices (GPS, sports watch, ...) to record their feats and log them to Strava. We obtained the data from 5 of those participants, and reworked that into the playful viz you'll find below. Interact and analyze by clicking the image, to open the viz in Tableau Public! (Or use the following link: https://public.tableau.com/profile/timothyvermeiren#!/vizhome/DatamotiveCyclingChallenge/DMCyclingChallenge)