Hi everyone!
This is my first blog post at Biztory! I’ve been at Biztory for the last month as an intern/student and my love for Tableau has grown enormous proportions. During my time here I’ve created tons of visualizations and I’d like to showcase this earthquake analysis since it is particularly actual.
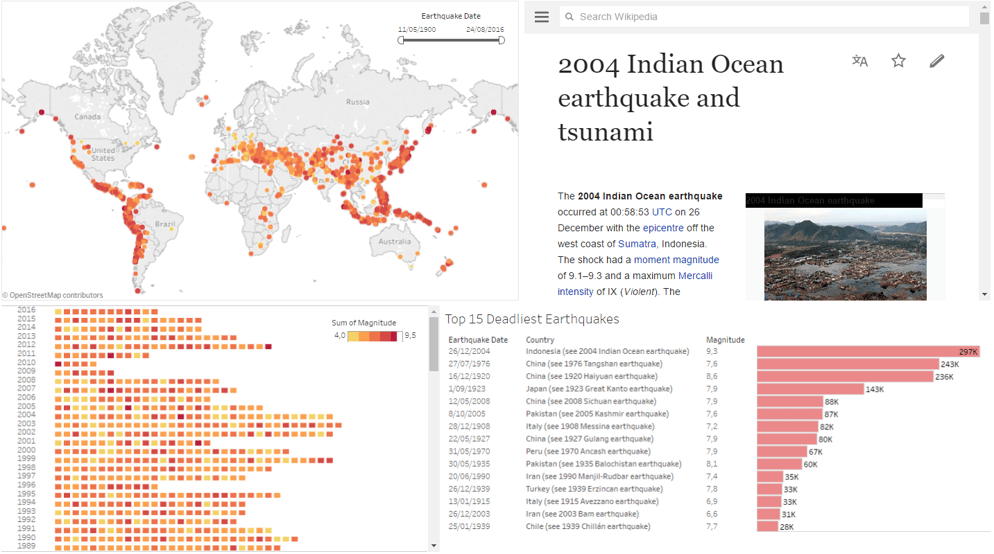
Keeping in mind the recent earthquake in Central Italy, killing over 240 people, I thought it would be interesting to see an overview of all recent deadly earthquakes in the world.
Our data goes way back to 1900 and shows an interesting trend. The last 20-30 years, there have been a lot more deadly earthquakes than before. Also 3 out of 10 most deadly earthquakes have occurred after 2000. Thinking about the fact that this data includes almost 120 years, this is not exactly a reassuring thought.
Logically most of the earthquakes are located on the boundaries of earth’s tectonic plates.
Only one of 15 most deadly earthquakes was located offshore. Although that one being the most deadly earthquake in recent history, it was actually not the quake itself, but the following tsunami resulting in over 240 000 casualties in Indonesia, 2004.
It seems that even despite world’s humanitarian and technological growth, we are still very vulnerable to nature’s disasters.
Check out the viz by clicking on the image below!